staking
Solana Decentralization Report — August 2026
A data-driven look at Solana validator decentralization for August 2026: stake concentration, geographic and client diversity, and validator movement trends.

Estimated Reading Time: 7 minutes
Summary
This month's Solana Decentralization Report covers 23 key metrics across validator concentration, geographic and client diversity, and stake movement trends for August 2026. Read on for the full breakdown, chart by chart.
Net Stake Change by Validator Size
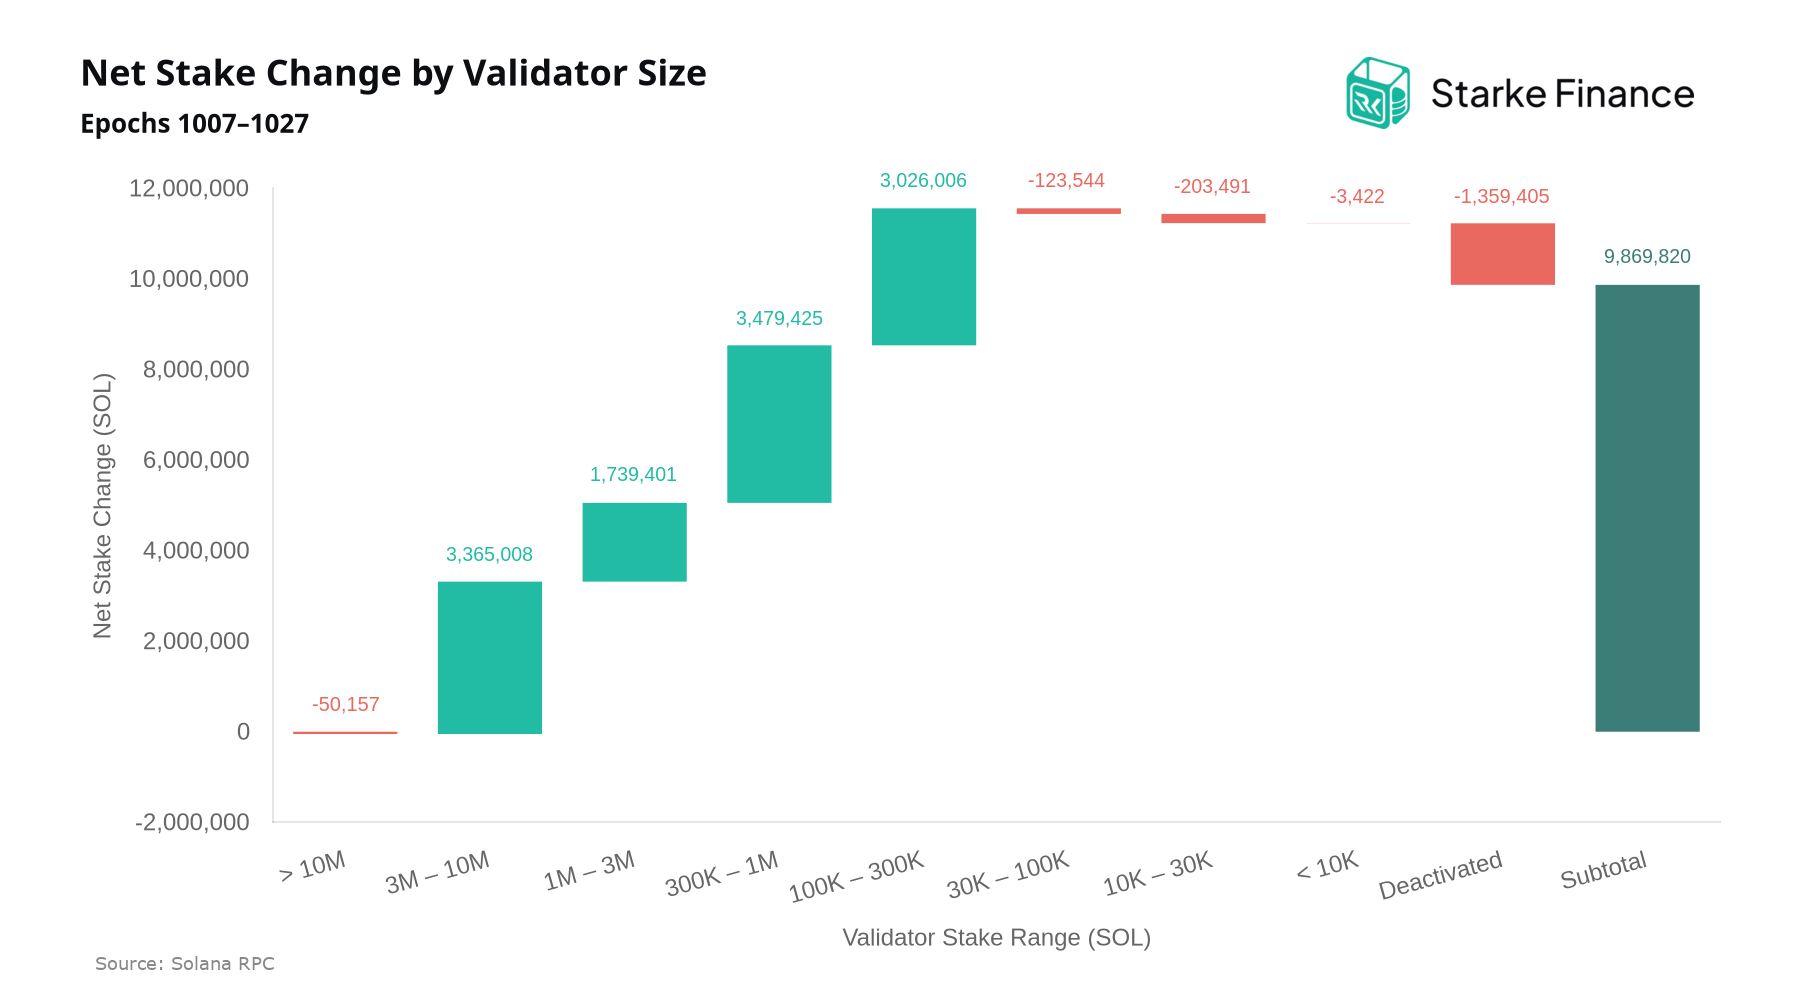
Over the past 20 epochs (roughly 30 days), net staked SOL across the network rose by approximately 9.9M SOL, a meaningful expansion of the active stake base. The distribution of those flows is instructive for anyone assessing decentralization: validators in the 300K–1M SOL band captured the largest share of net inflows at ~3.5M SOL, while deactivated validators accounted for the largest net outflow at ~1.4M SOL.
Solana Stake Distribution Lorenz Curve
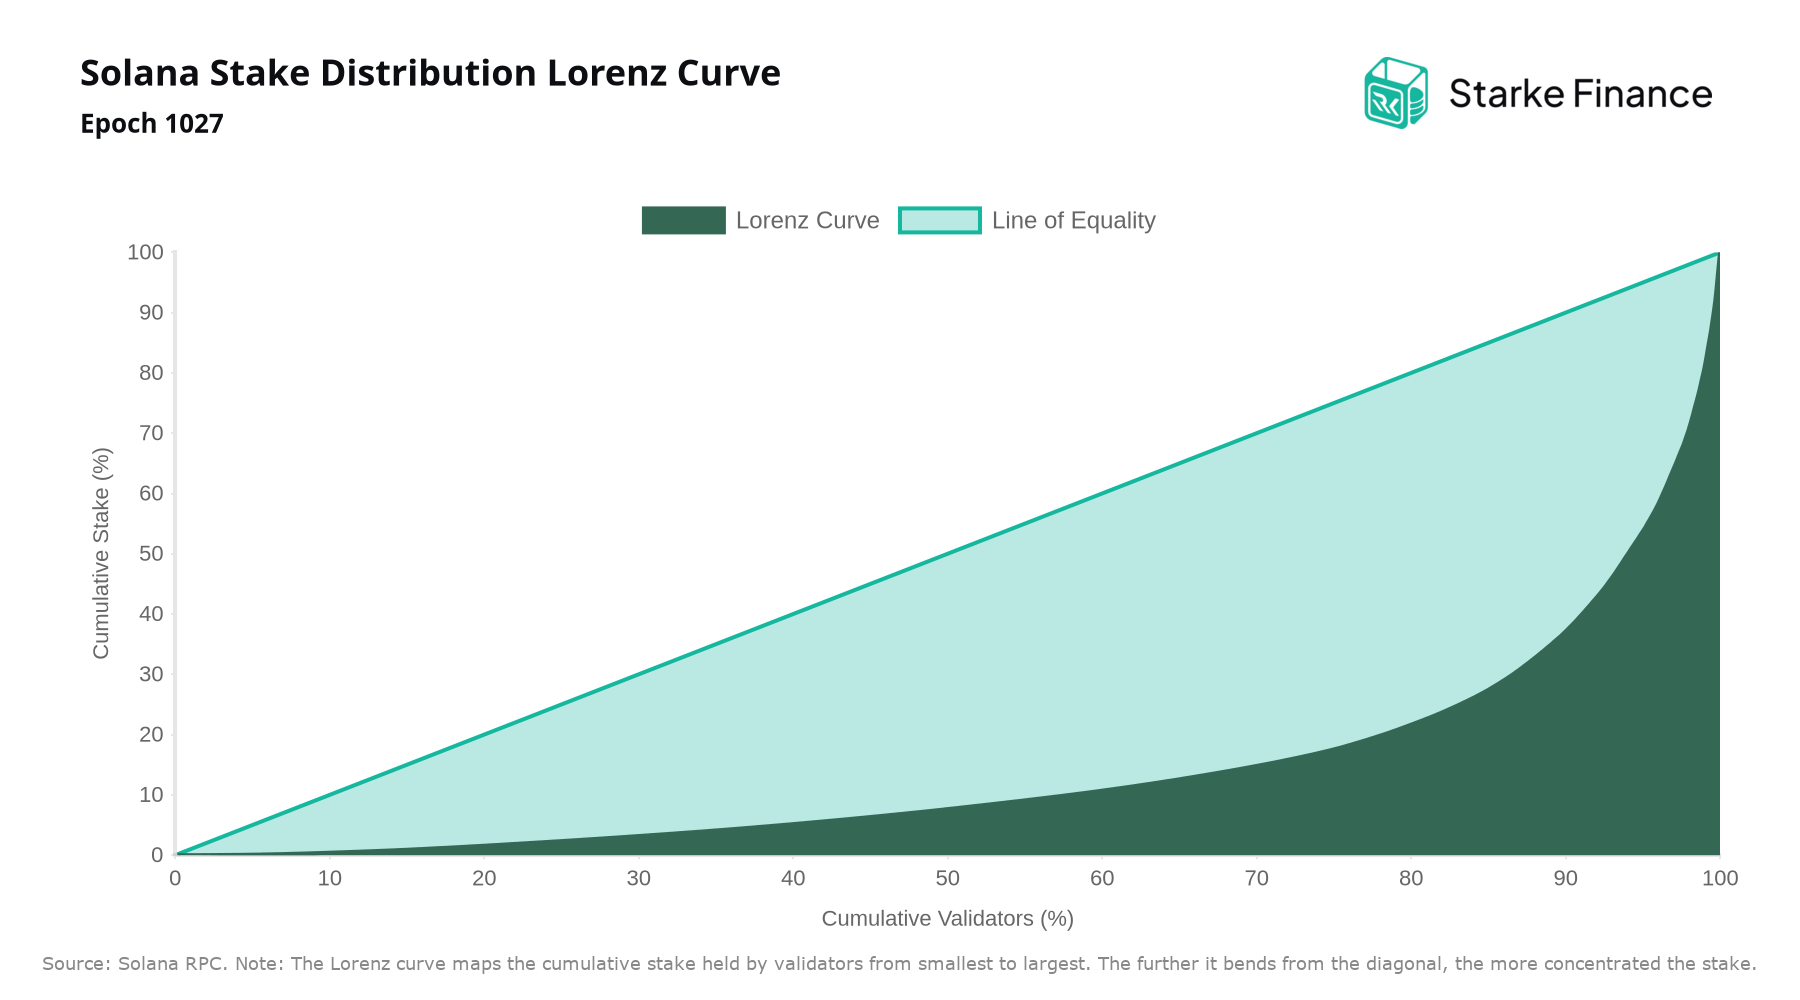
The Lorenz curve and its associated Gini coefficient remain the clearest single measure of how evenly stake is spread across Solana's validator set, where 0 denotes perfect equality and 1 total concentration by a single validator. Over the past 20 epochs, roughly 30 days, the coefficient moved from 0.7353 to 0.7282, an exceptional decrease that points to a modest but meaningful broadening of stake across active validators.
Solana Stake Control Thresholds
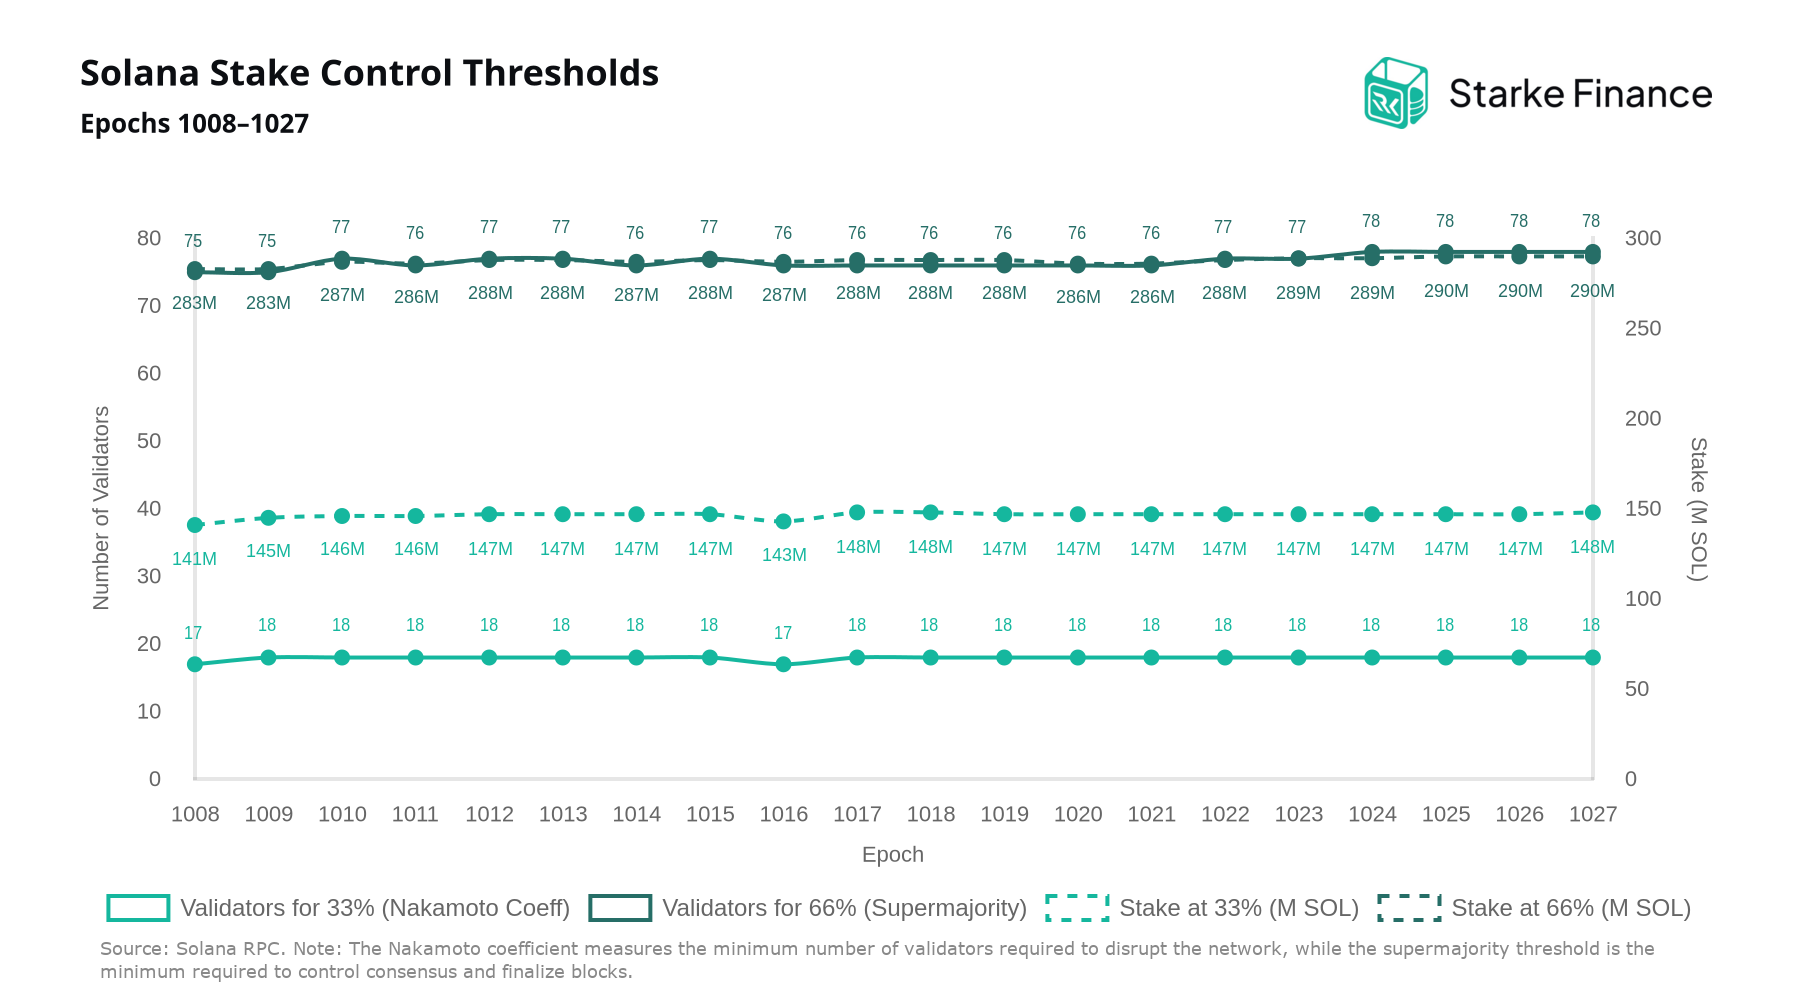
Solana's Nakamoto coefficient rose from 17 to 18 over the last 20 epochs, indicating stronger decentralization as more validators are now required to halt block production. The supermajority threshold also moved from 75 to 78 validators, meaning that seizing full control of consensus has become measurably harder.
Stake Concentration: Herfindahl-Hirschman Index (HHI)
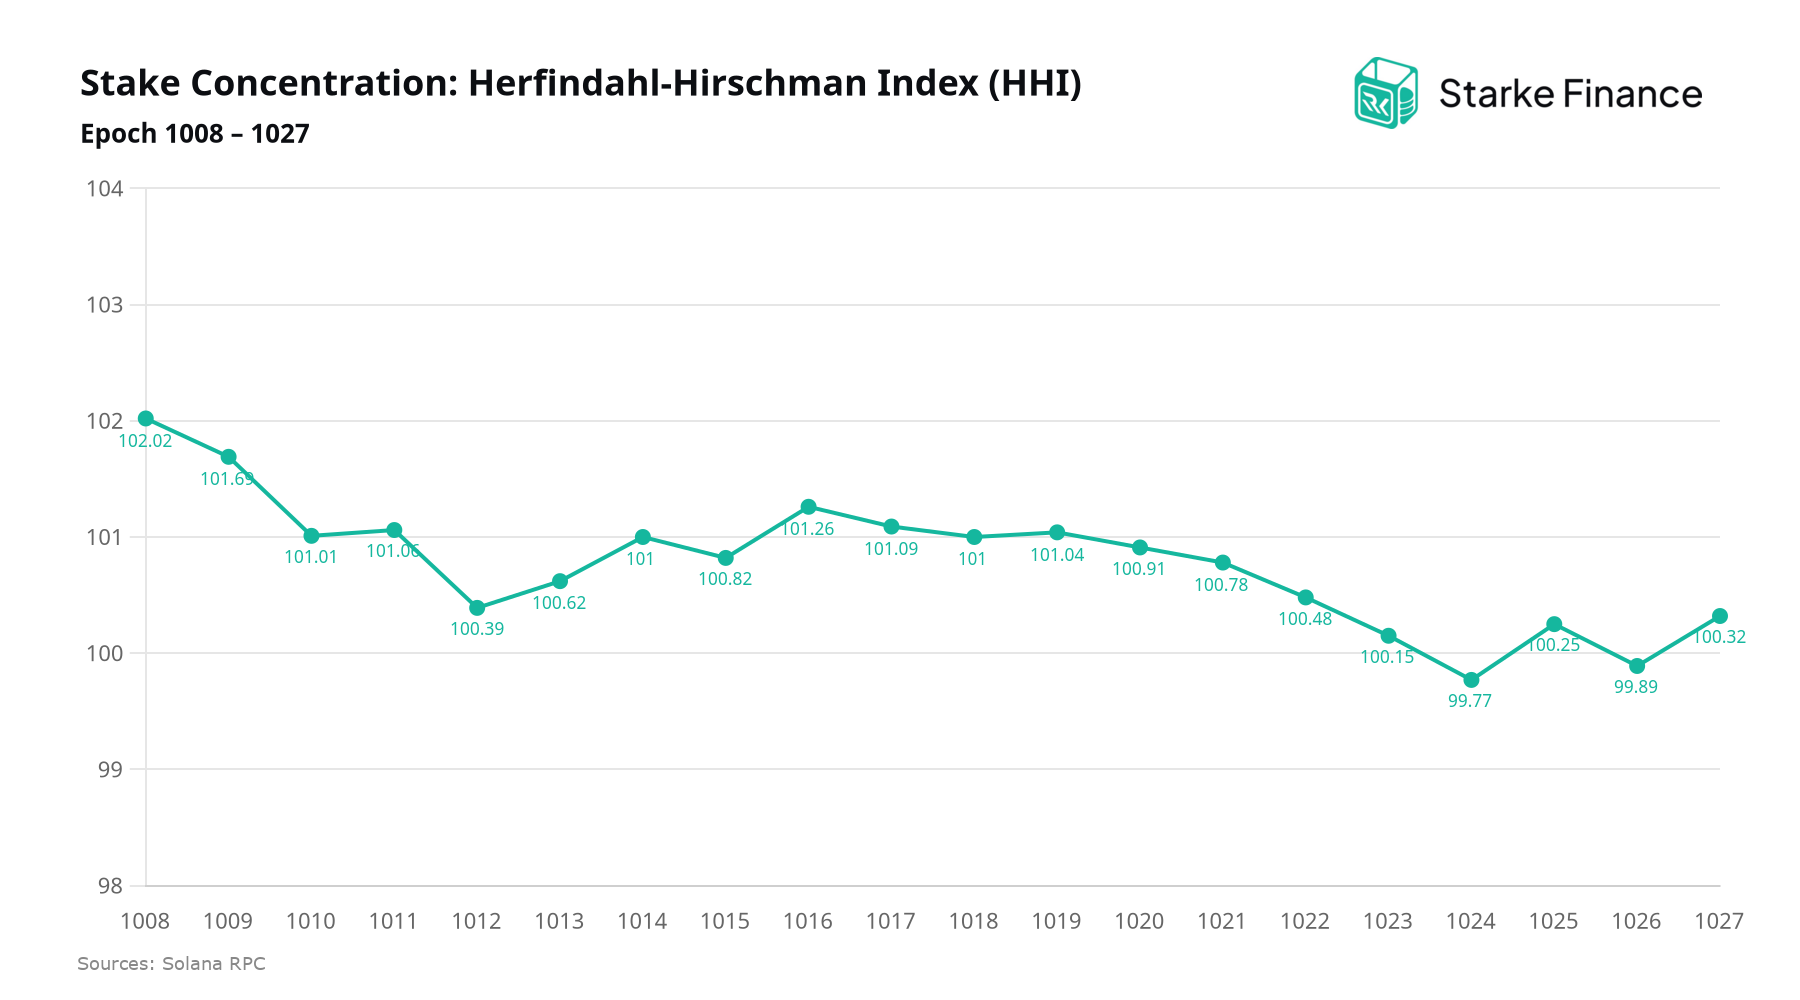
While the Gini coefficient captures inequality across the full distribution, the Herfindahl-Hirschman Index (HHI) is a better lens for effective concentration, weighting participants by the square of their stake share to reveal how many validators meaningfully anchor the network. Between epoch 1008 and epoch 1027, the HHI moved within a narrow band of 99.77 to 102.02, pointing to a stable and broad validator base.
Stake Share by Top Staked Validators
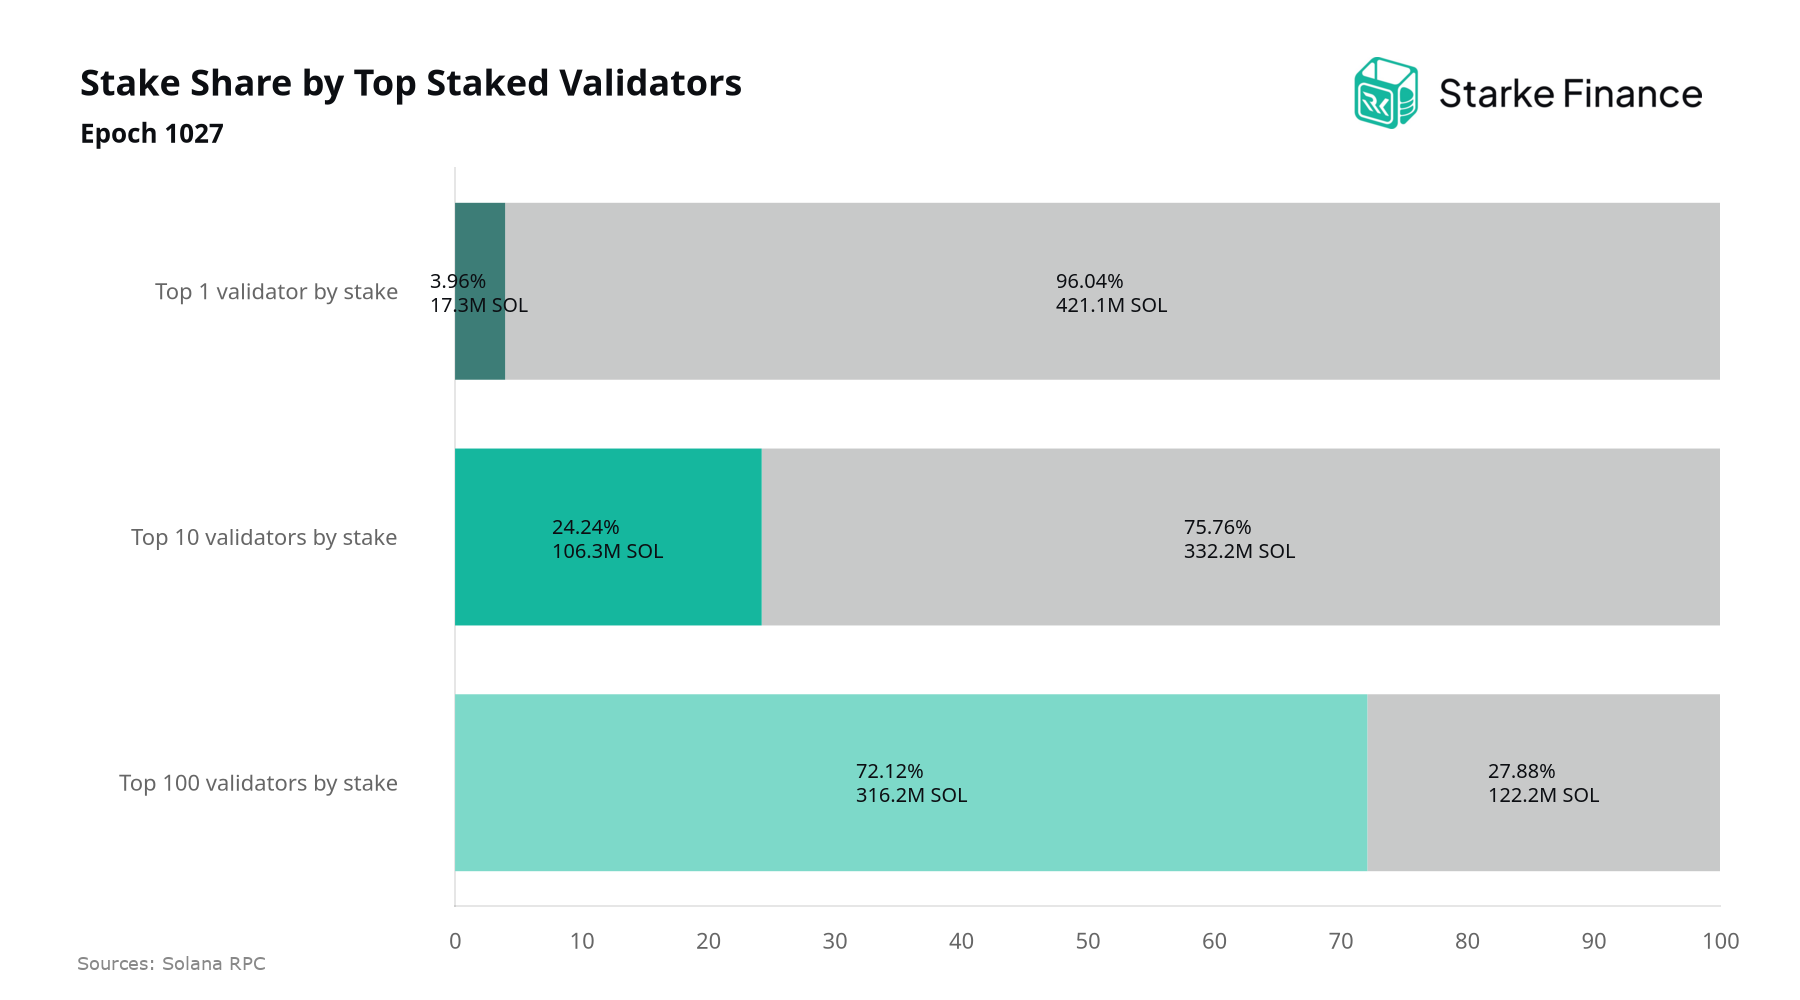
At epoch 1027, the top staked validator holds 3.96% of total stake (17.3M SOL), the top 10 collectively account for 24.24% (106.3M SOL), and the top 100 for 72.12% (316.2M SOL). These concentration figures are a useful benchmark for stakers assessing counterparty and liveness risk, since stake distribution across the validator set directly influences the network's resilience to correlated downtime or coordinated behavior.
Stake Share by Top Staked Validators per Epoch
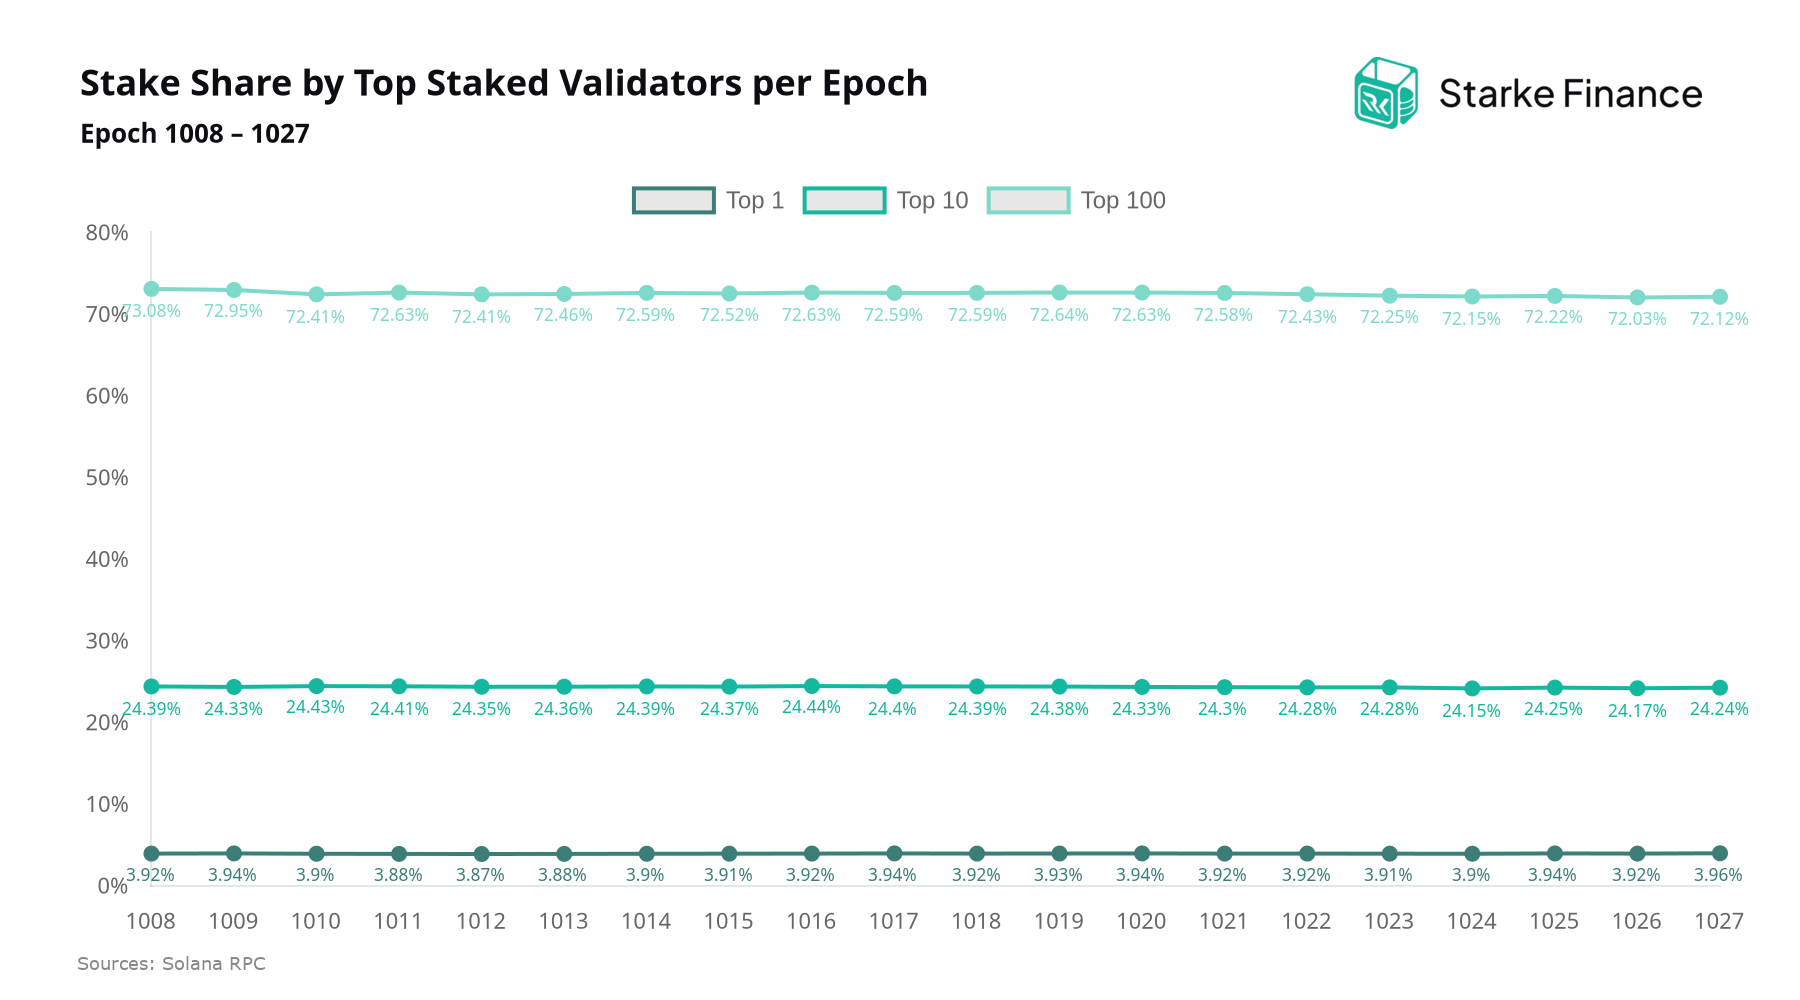
Across epochs 1008–1027, stake concentration among Solana's largest validators moved in mixed directions. The single largest validator edged up from 3.92% to 3.96%, while the top 10 cohort eased from 24.39% to 24.24% and the top 100 declined from 73.08% to 72.12%. The modest broadening at the top-10 and top-100 tiers is directionally supportive of validator decentralization, a key input for network resilience and censorship resistance that stakers should weigh when selecting delegation targets.
Validator Count by Epoch
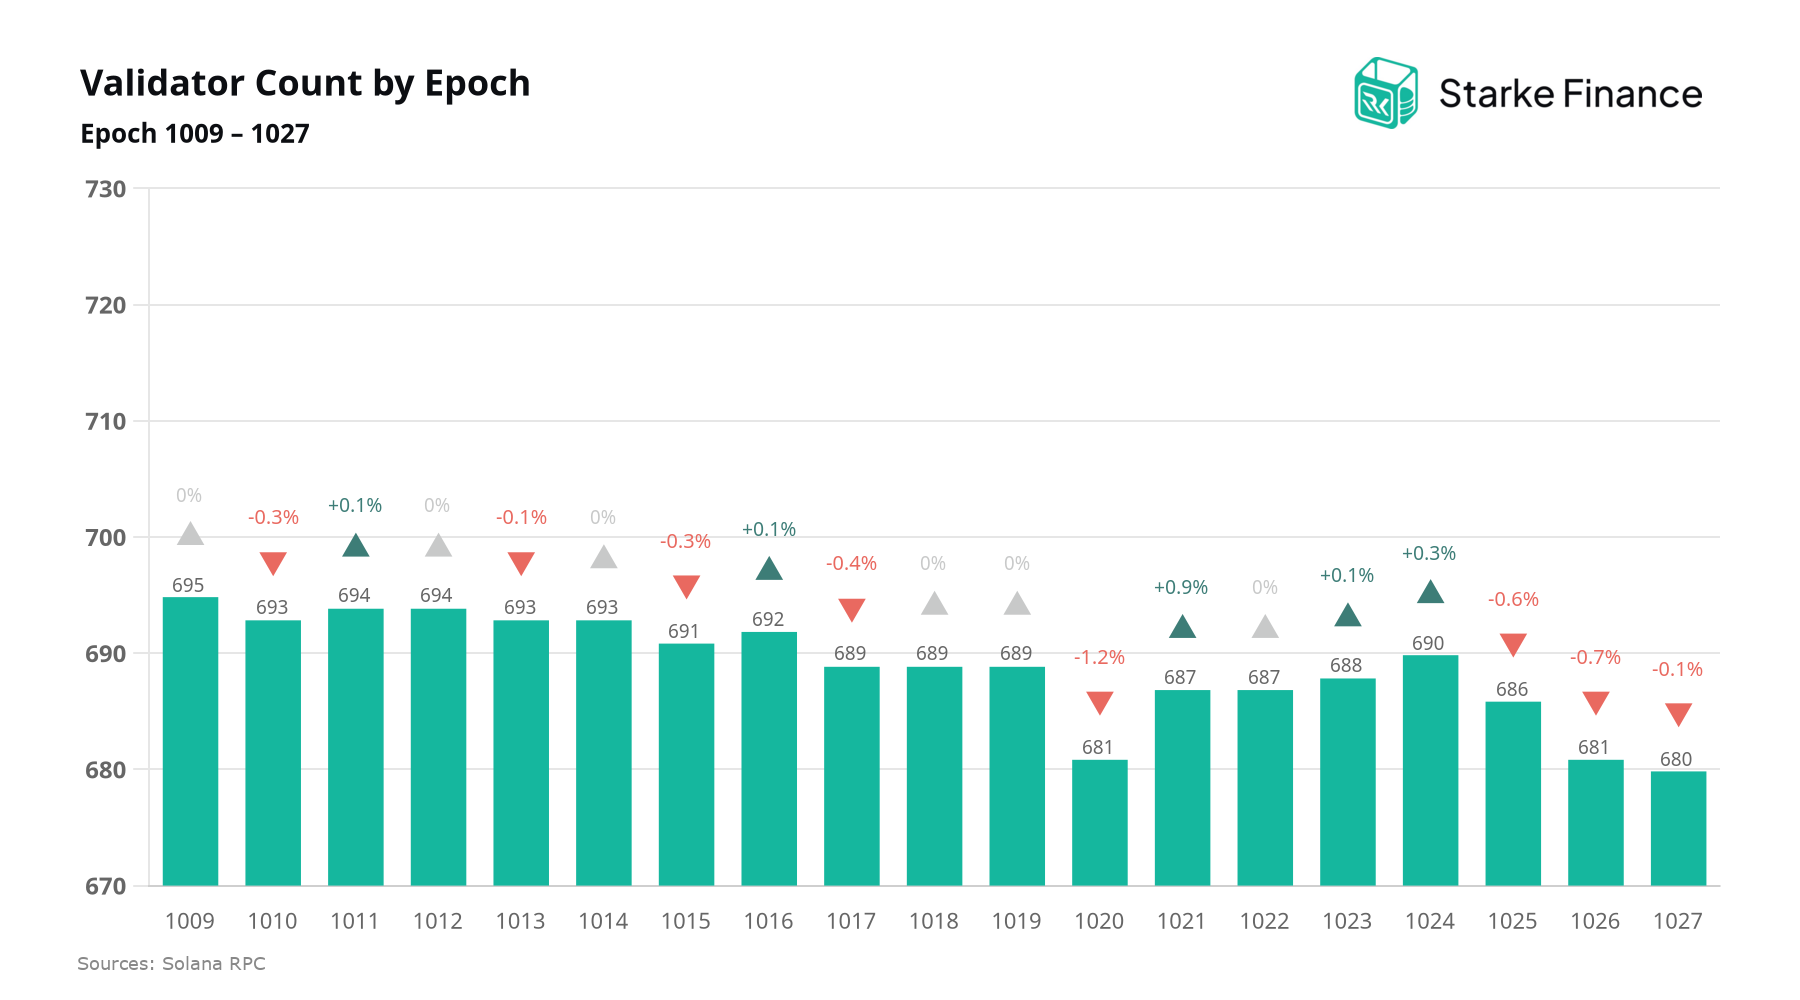
The active validator set contracted from 695 to 680 across epochs 1009–1027, a decline of 2.2%, with the sharpest single-epoch move occurring at epoch 1020 (-1.2%). A modest reduction of this magnitude is not unusual over a two-week window, but the direction warrants monitoring: validator count is a primary input to network decentralization, and sustained attrition can concentrate stake among remaining operators. Delegators should weigh operator selection accordingly.
Number of Validators Gaining, Losing and Stable Stake by Epoch
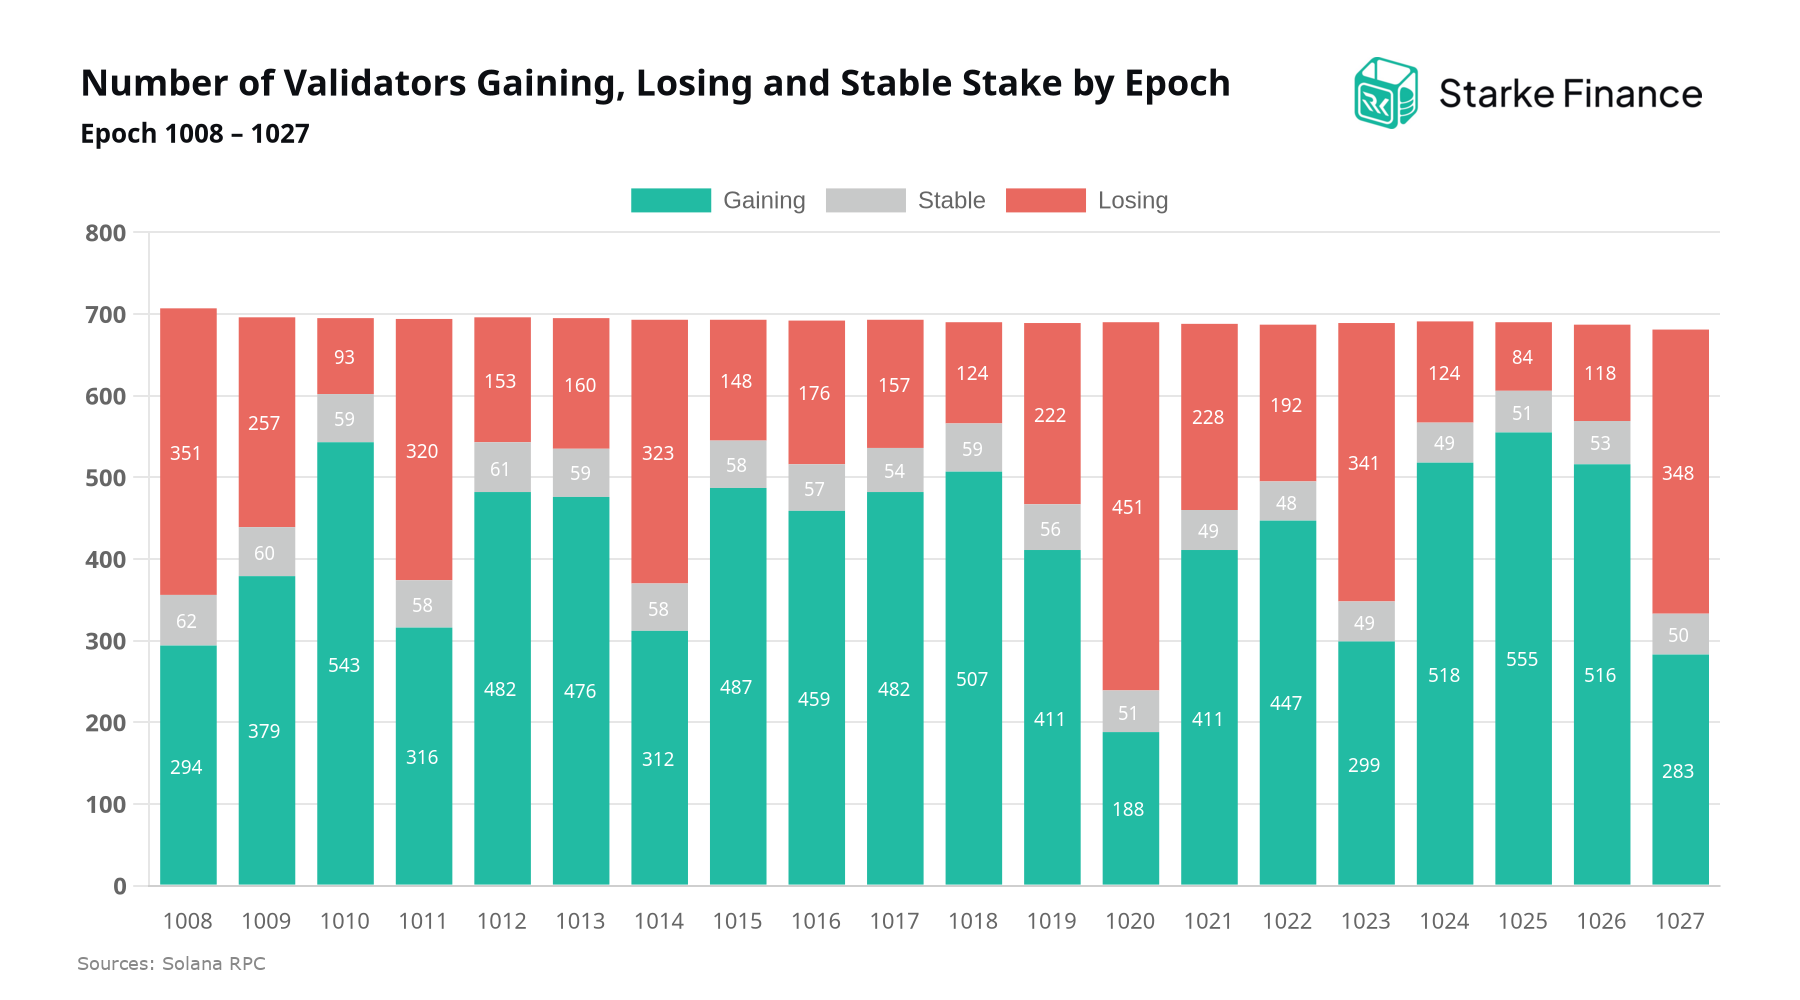
Across epochs 1008–1027, total active stake rose by 10,161,543 SOL, but the distribution of that growth is more informative than the headline figure. On average, 60.46% of validators gained stake each epoch, 31.58% saw net outflows, and 7.96% remained stable.
Stake Inflow, Outflow & Churn Rate by Epoch
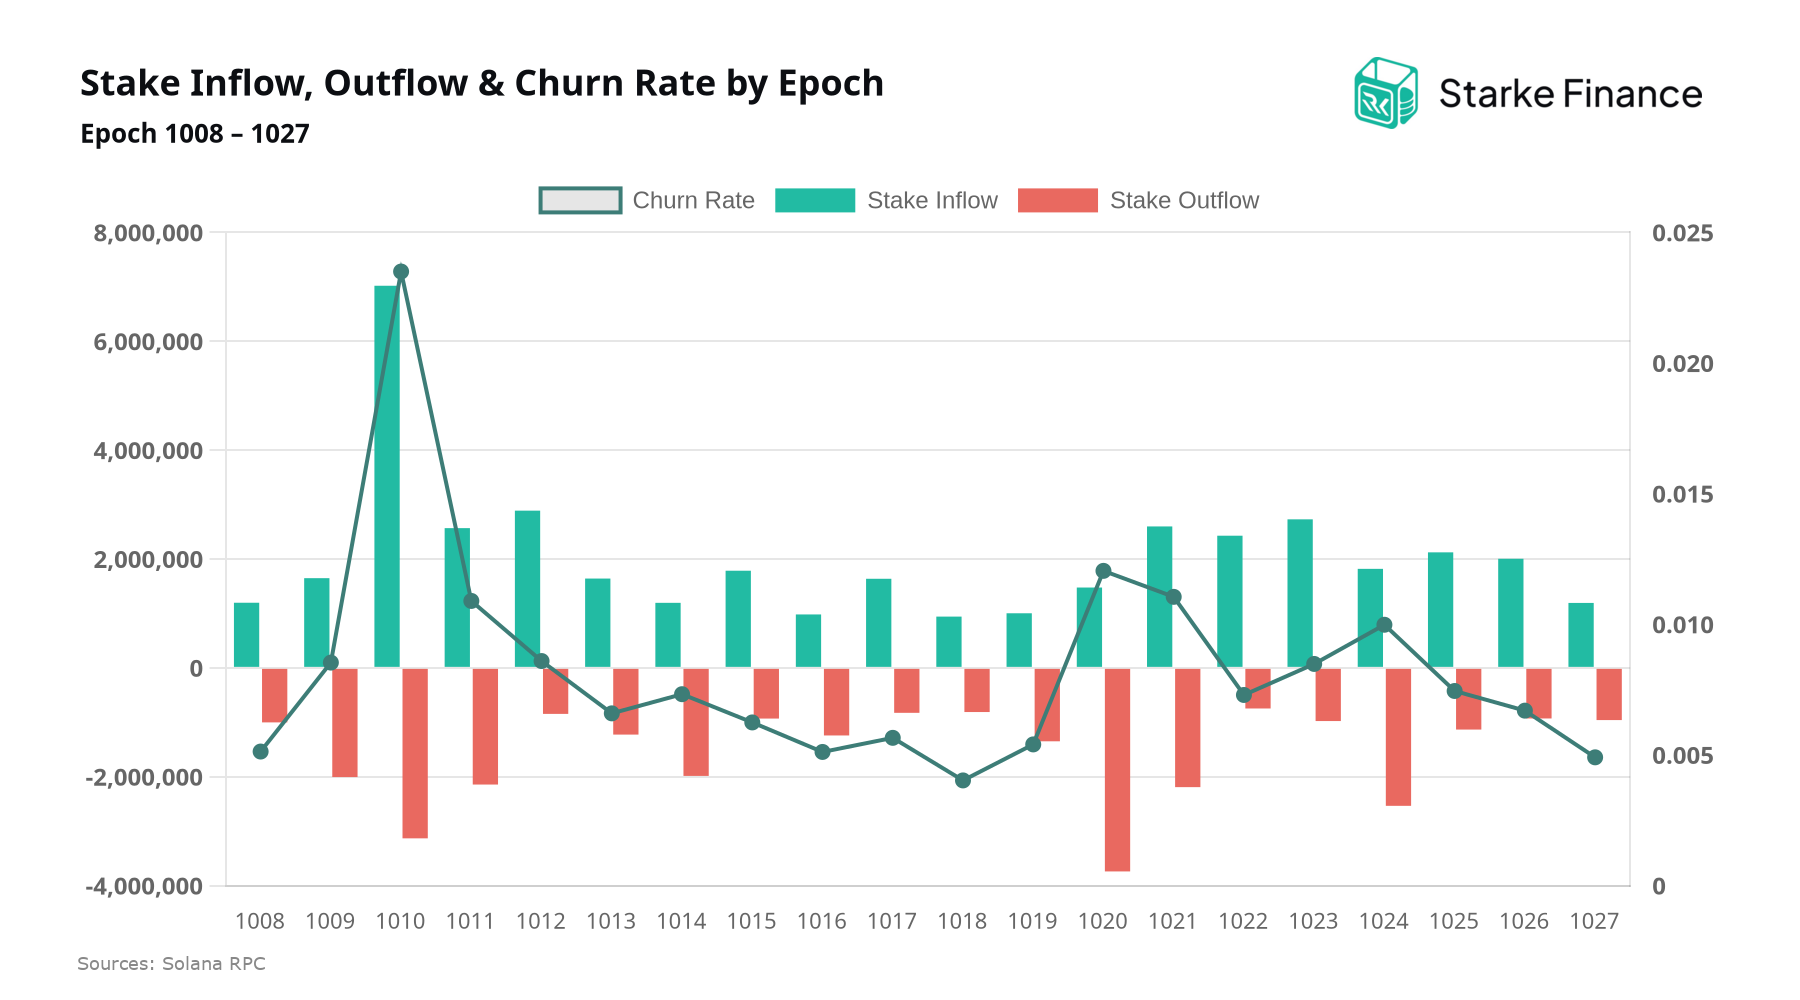
Epoch-level stake flows provide a useful lens on delegator behavior and validator competition. Over the observed period, epoch 1010 recorded the strongest inflow at 7.0M SOL, while epoch 1020 marked the largest outflow at -3.7M SOL. Churn rate, defined as stake movement relative to total network stake, ranged from 0.40% to 2.35% and trended lower over time, indicating moderating reallocation activity.
Spearman Rank Persistence by Epoch
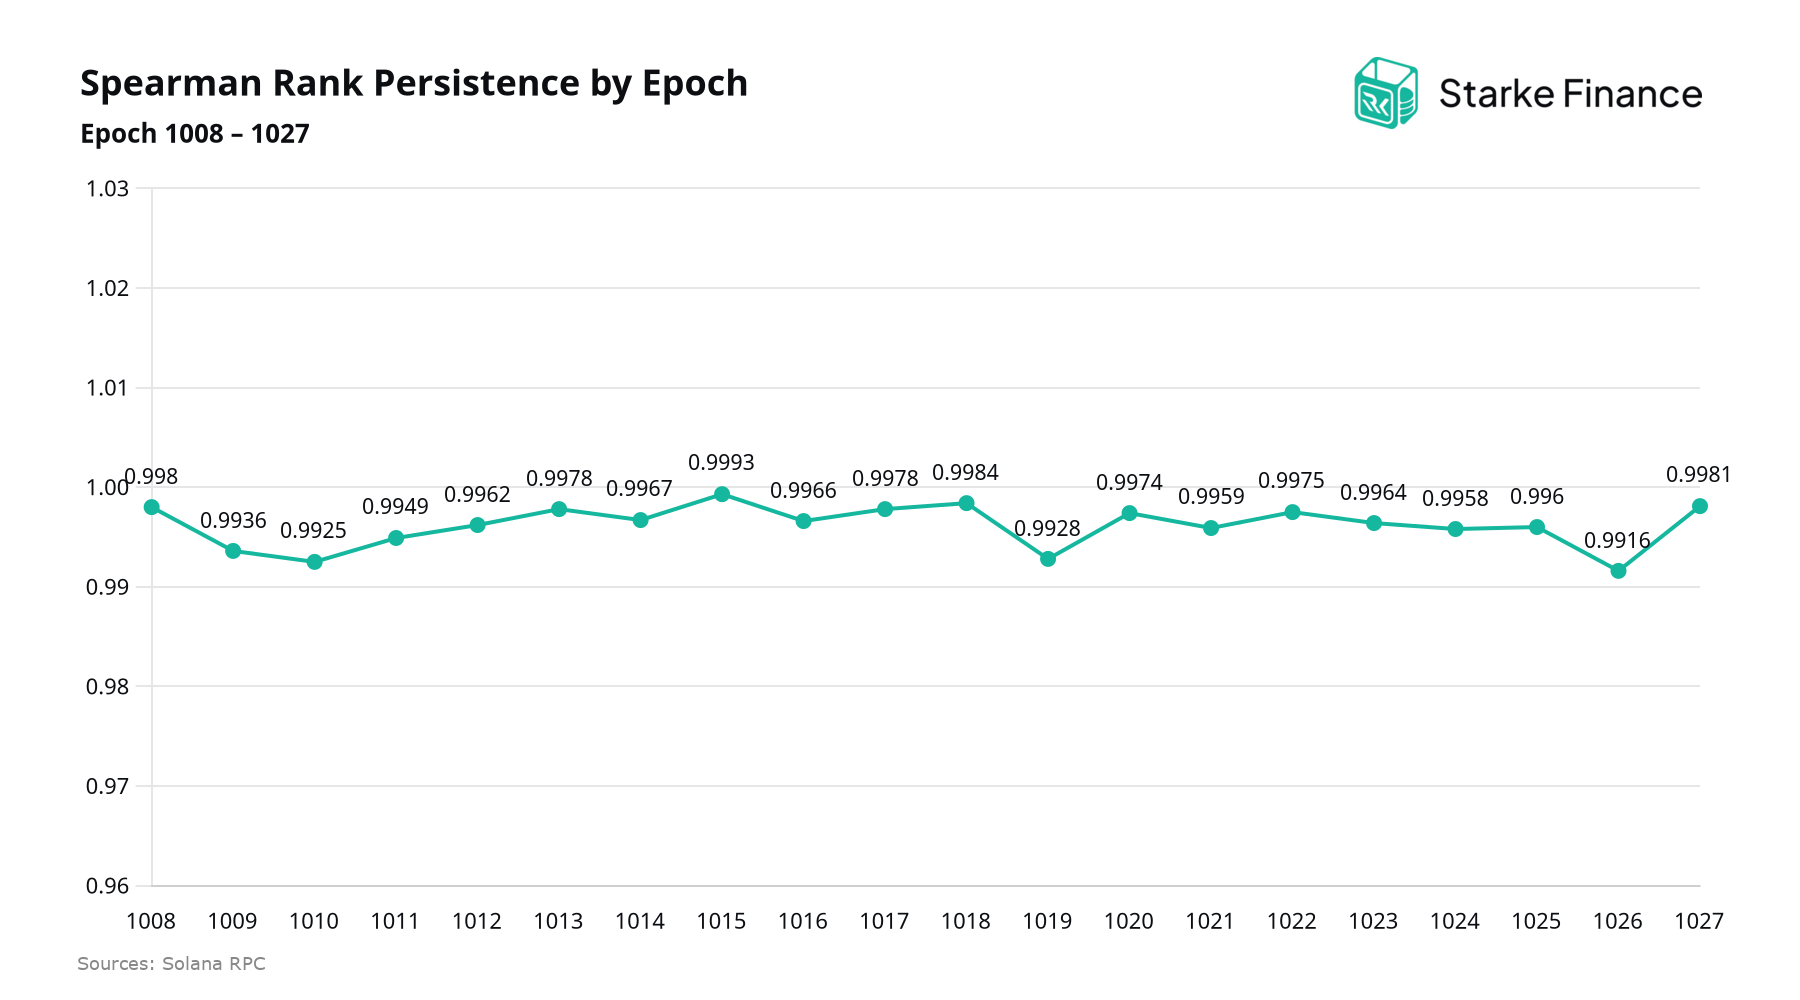
Spearman Rank Persistence measures how stable the validator ranking by stake is from one epoch to the next, with values closer to 1 indicating minimal reshuffling among validators. Across epochs 1008–1027, readings ranged from 0.9916 to 0.9993, pointing to a highly stable ordering in which most validators maintained similar relative positions.
Validator Distribution by Stake Balance
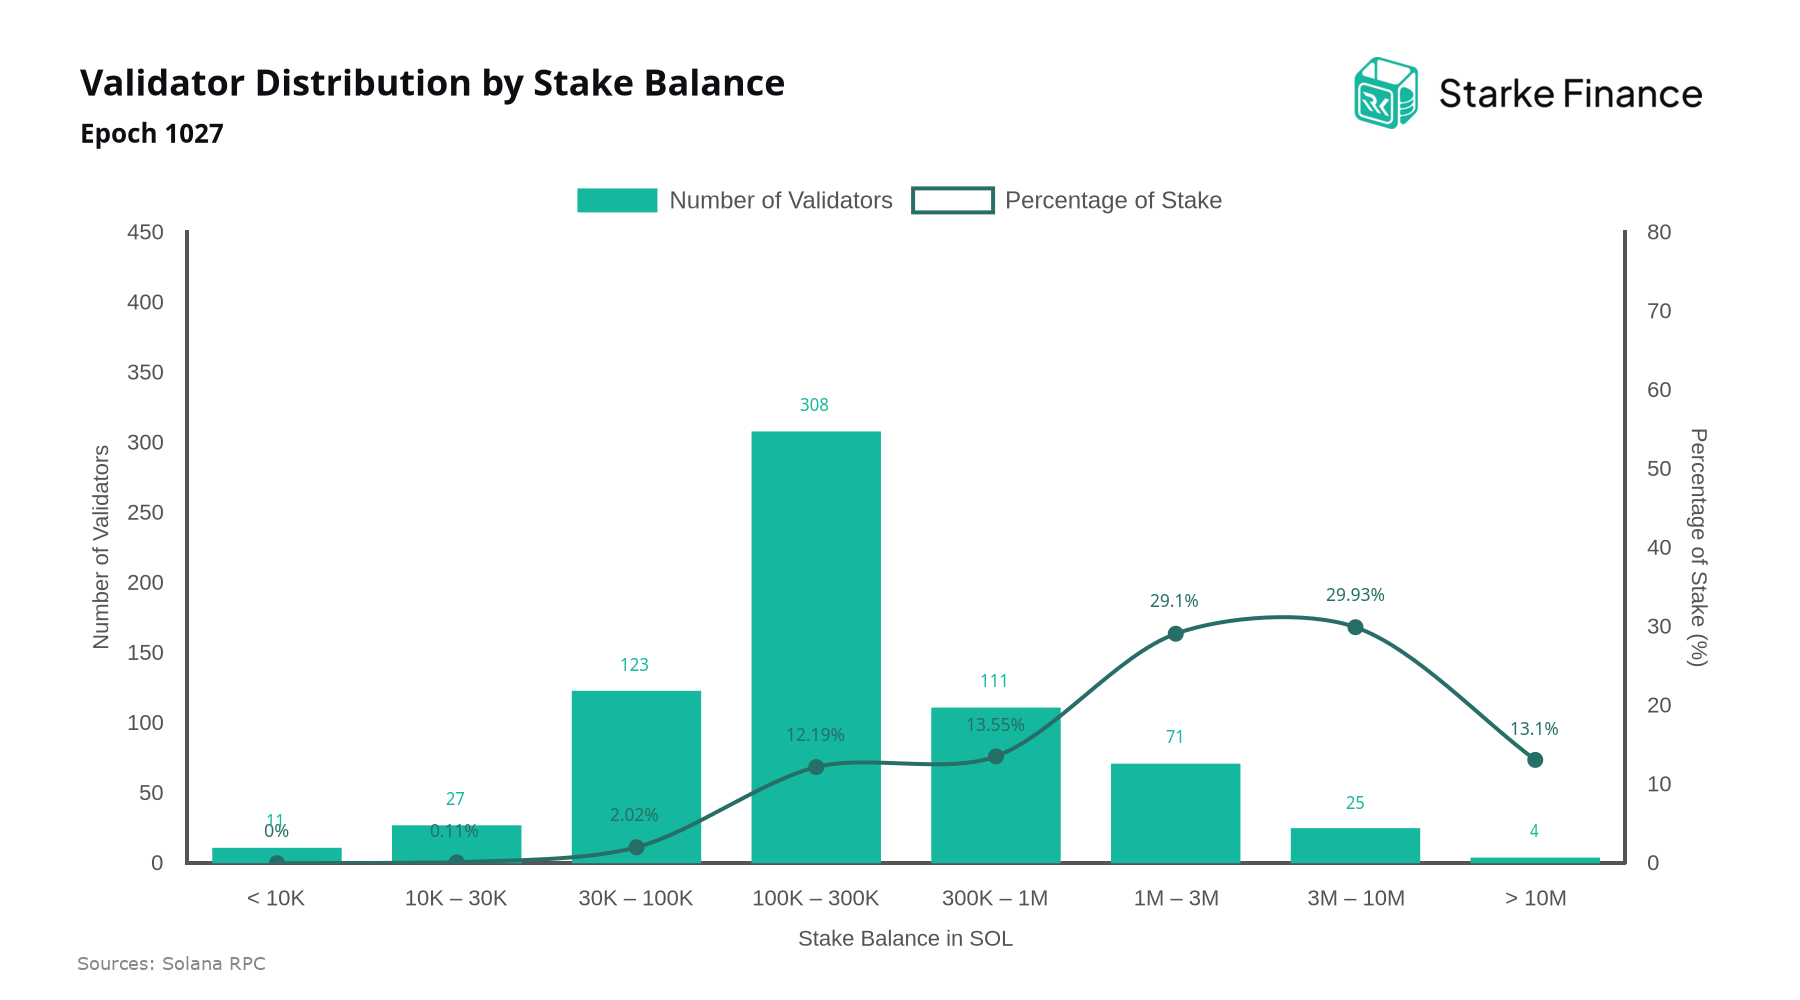
As of epoch 1027, the 3M–10M SOL cohort leads stake concentration at 29.93% across just 25 validators, closely followed by the 1M–3M SOL band at 29.10% spread over 71 validators. Together these tiers anchor the majority of active stake, underscoring that mid-to-large operators remain the network's structural core.
Validator Distribution by Stake Balance by Epoch
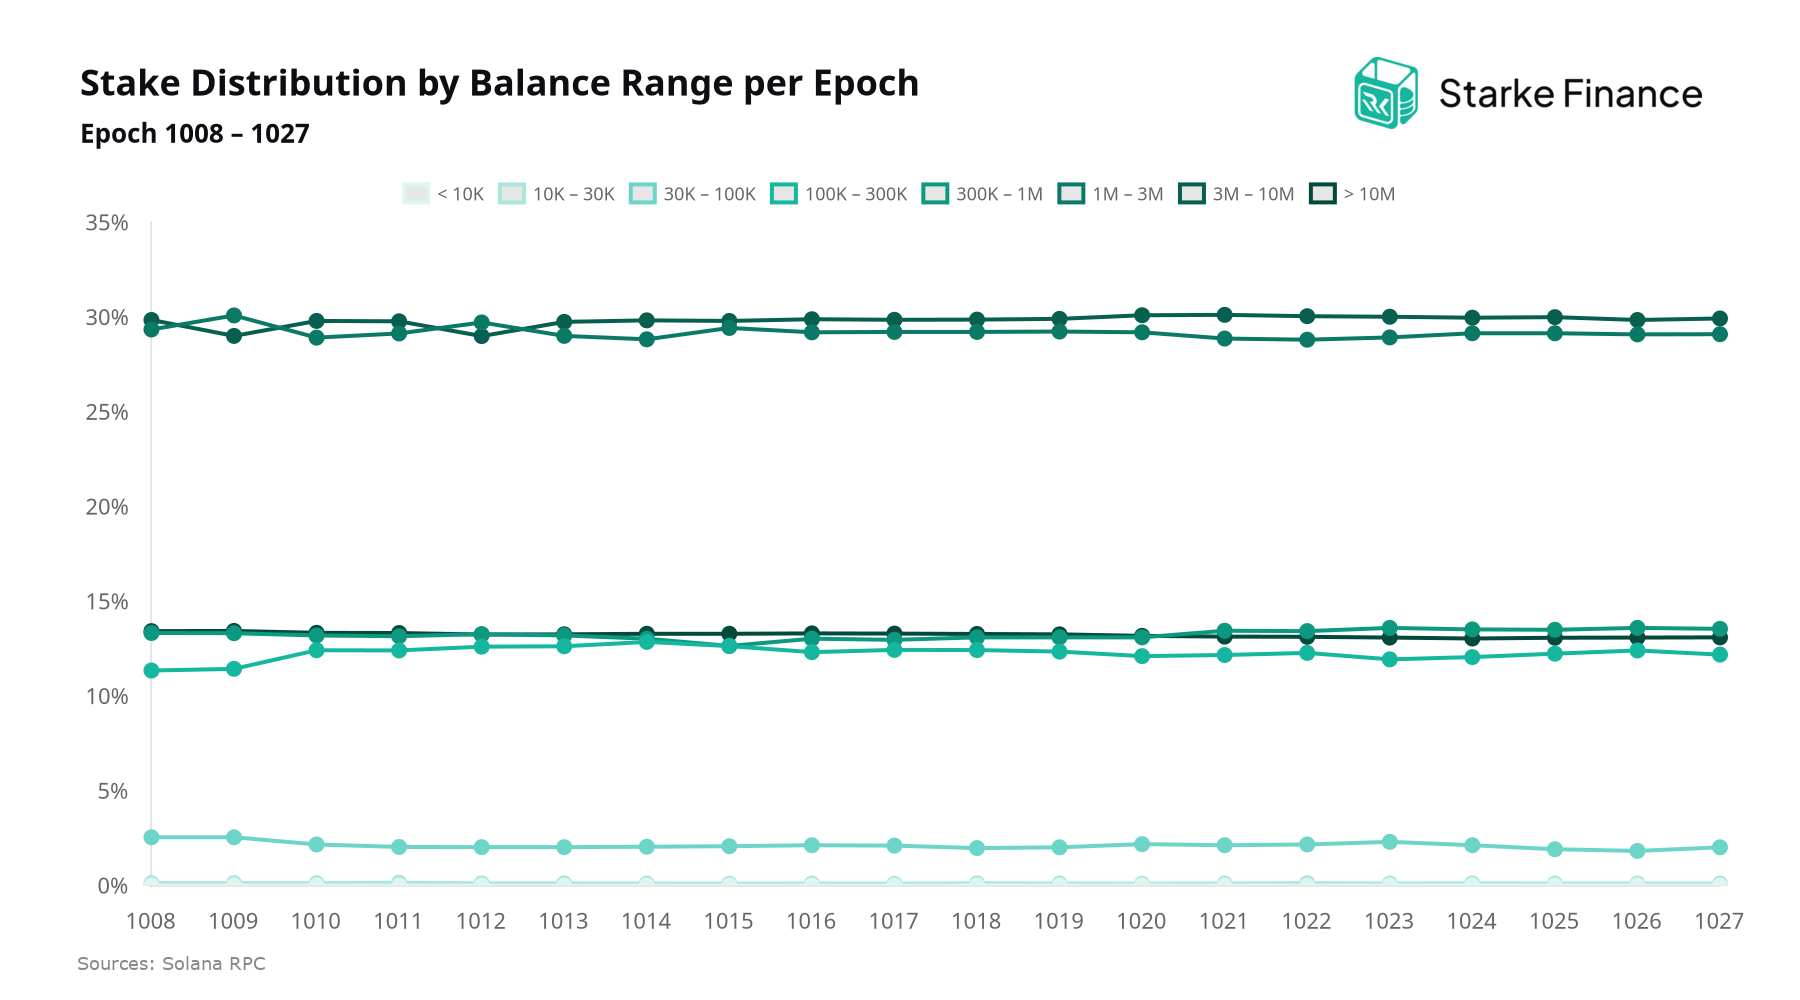
Between epochs 1008 and 1027, the validator cohort holding 100K–300K SOL recorded the most notable expansion, rising from 11.35% to 12.19% of stake share, while the 30K–100K SOL band contracted from 2.55% to 2.02%. The shift points to a gradual consolidation within the mid-tier of the validator set, a segment worth monitoring by delegators evaluating decentralization, as stake continues migrating toward operators with greater scale rather than dispersing across smaller nodes.
Solana Validator Client Distribution
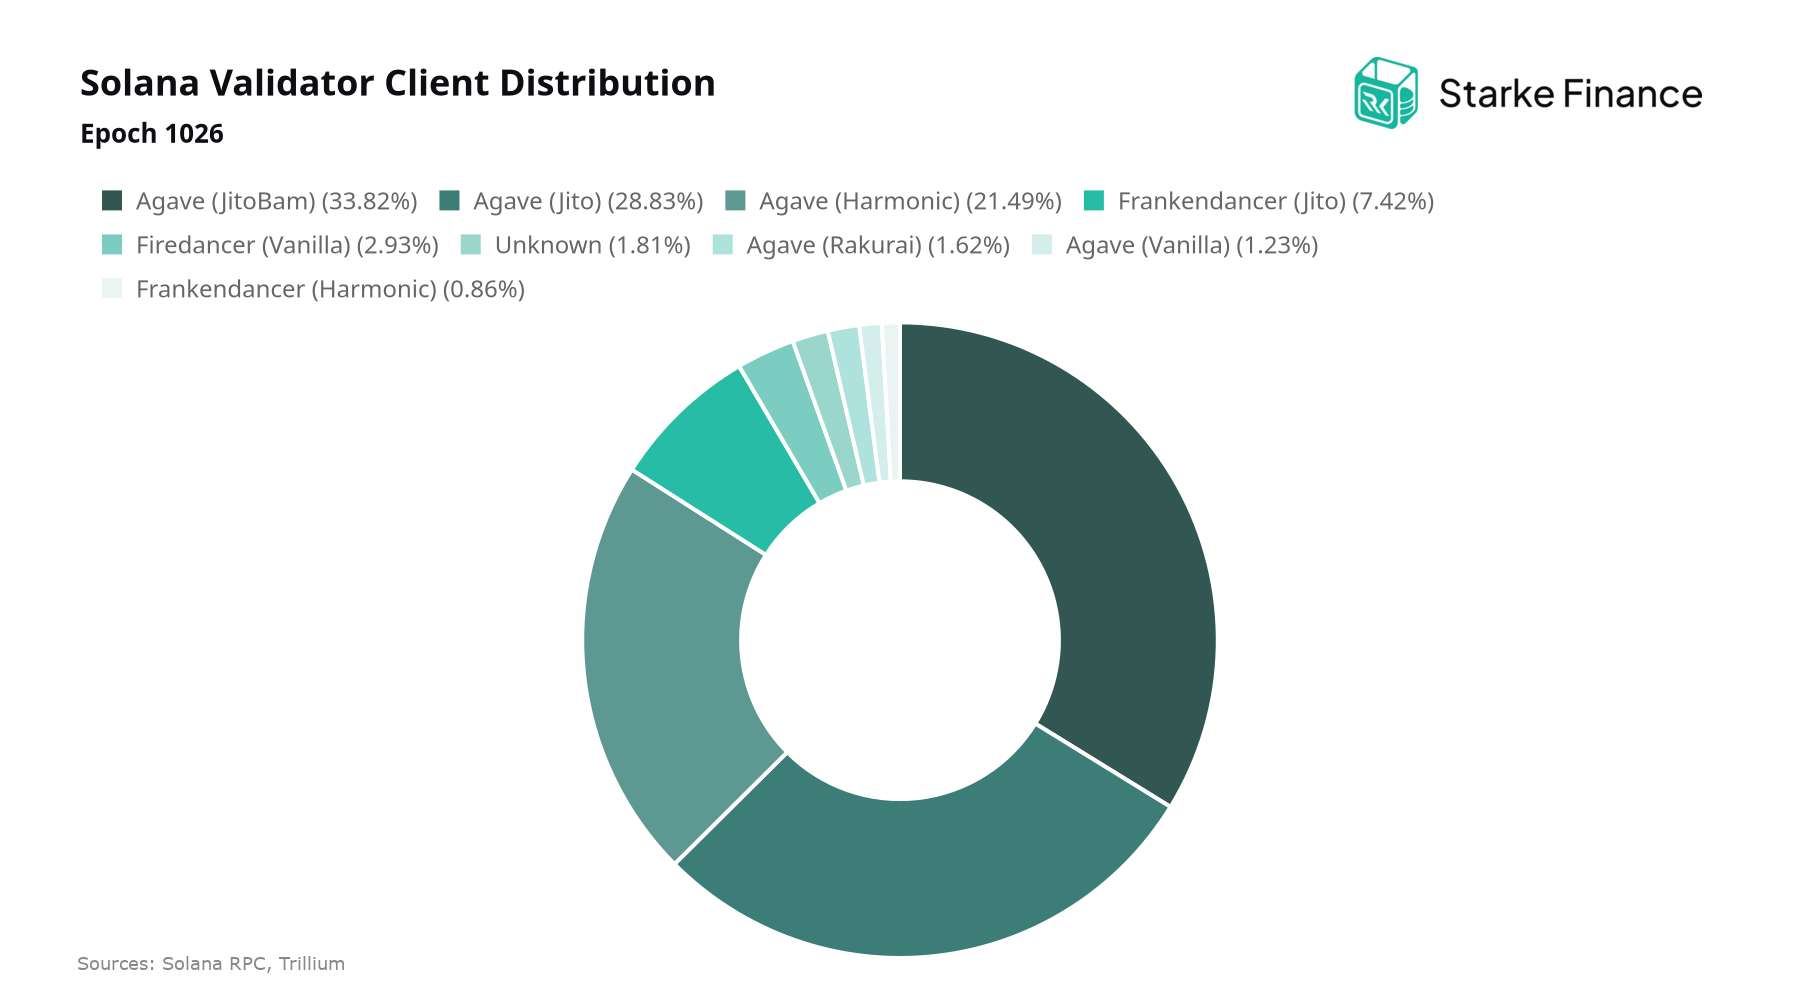
As of Epoch 1026, Agave dominates Solana's validator client landscape with 381M SOL (88.6%) across 613 validators, followed by Frankendancer at 36M SOL (8.4%) across 34 validators and Firedancer at 13M SOL (3.0%) across 10 validators. Breaking this down by client-scheduler combination, Agave (JitoBam) accounts for 148M SOL (34%) across 373 validators, while Agave (Jito) represents 126M SOL (29%) across 147 validators.
Solana Client Stake Distribution
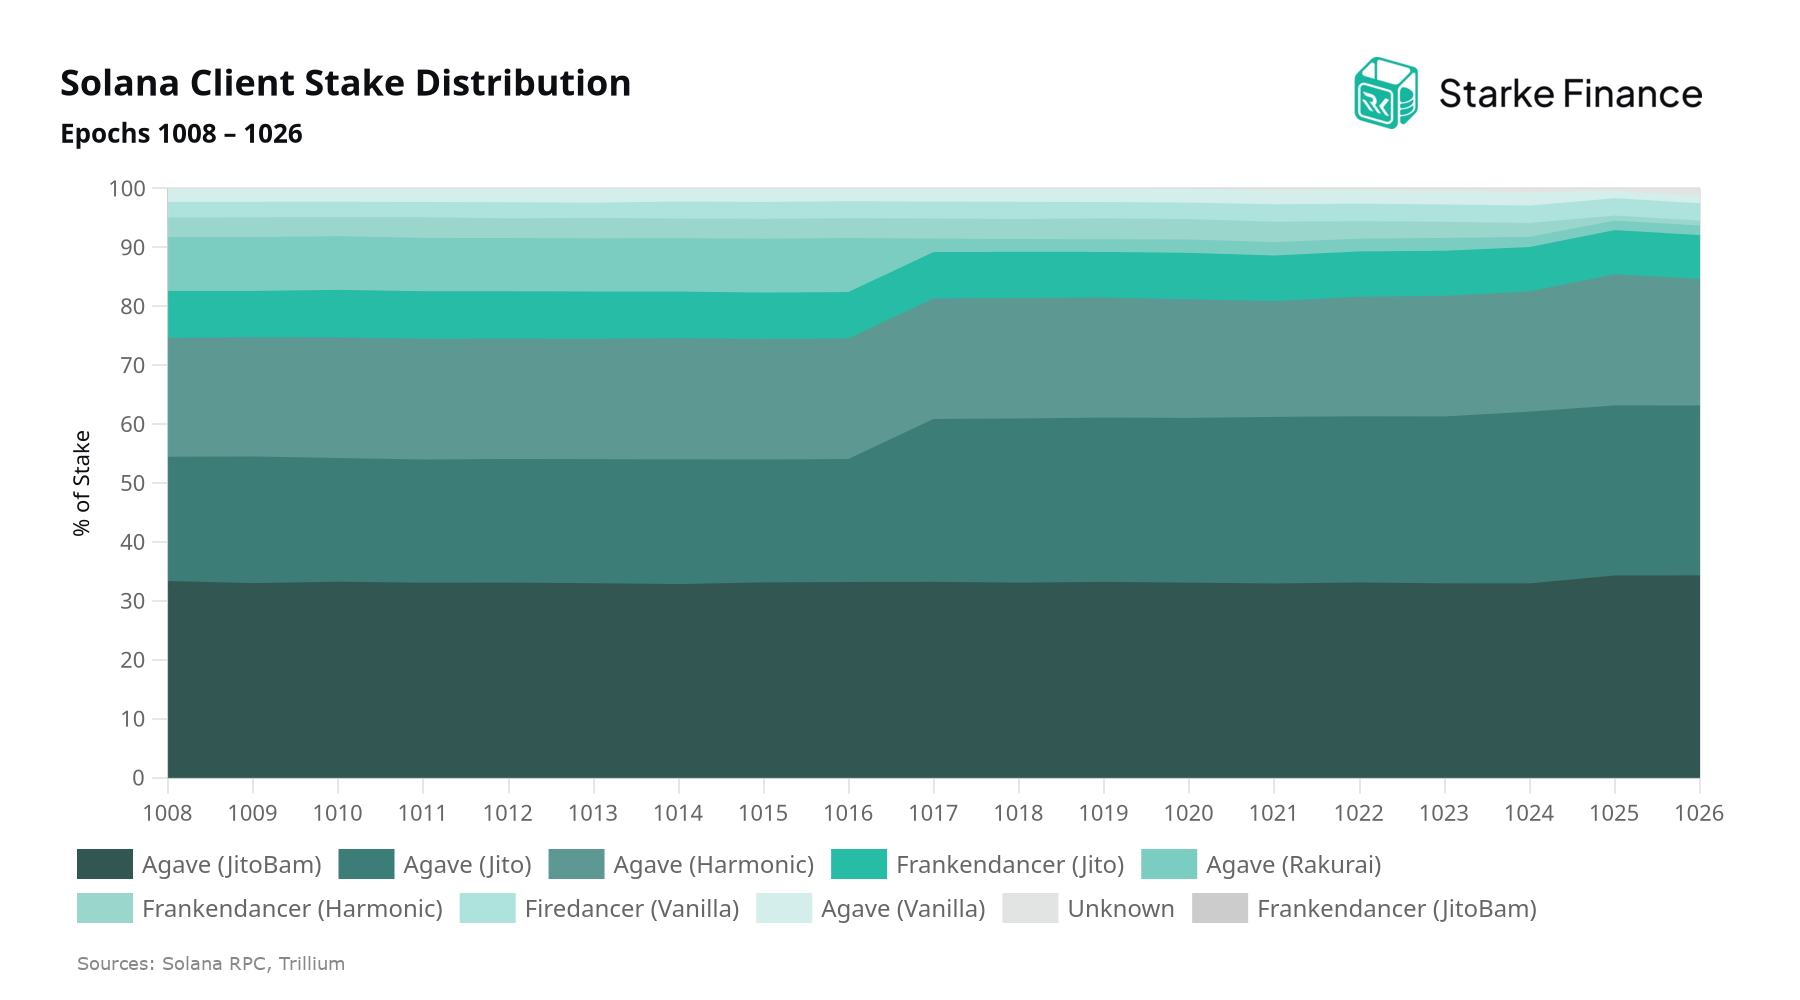
Client diversity remains a core input to Solana network resilience, and the latest epoch range shows the distribution shifting rather than broadening. Agave gained share, up from 86.0% at epoch 1008 to 88.6% at epoch 1026, while Frankendancer lost ground, from 11.3% to 8.4%, and Firedancer edged higher from 2.6% to 3.0%. Underneath, Agave validator count fell from 622 to 613 even as stake rose 3.8%, indicating consolidation among larger operators.
SOL Supply Distribution by Epoch
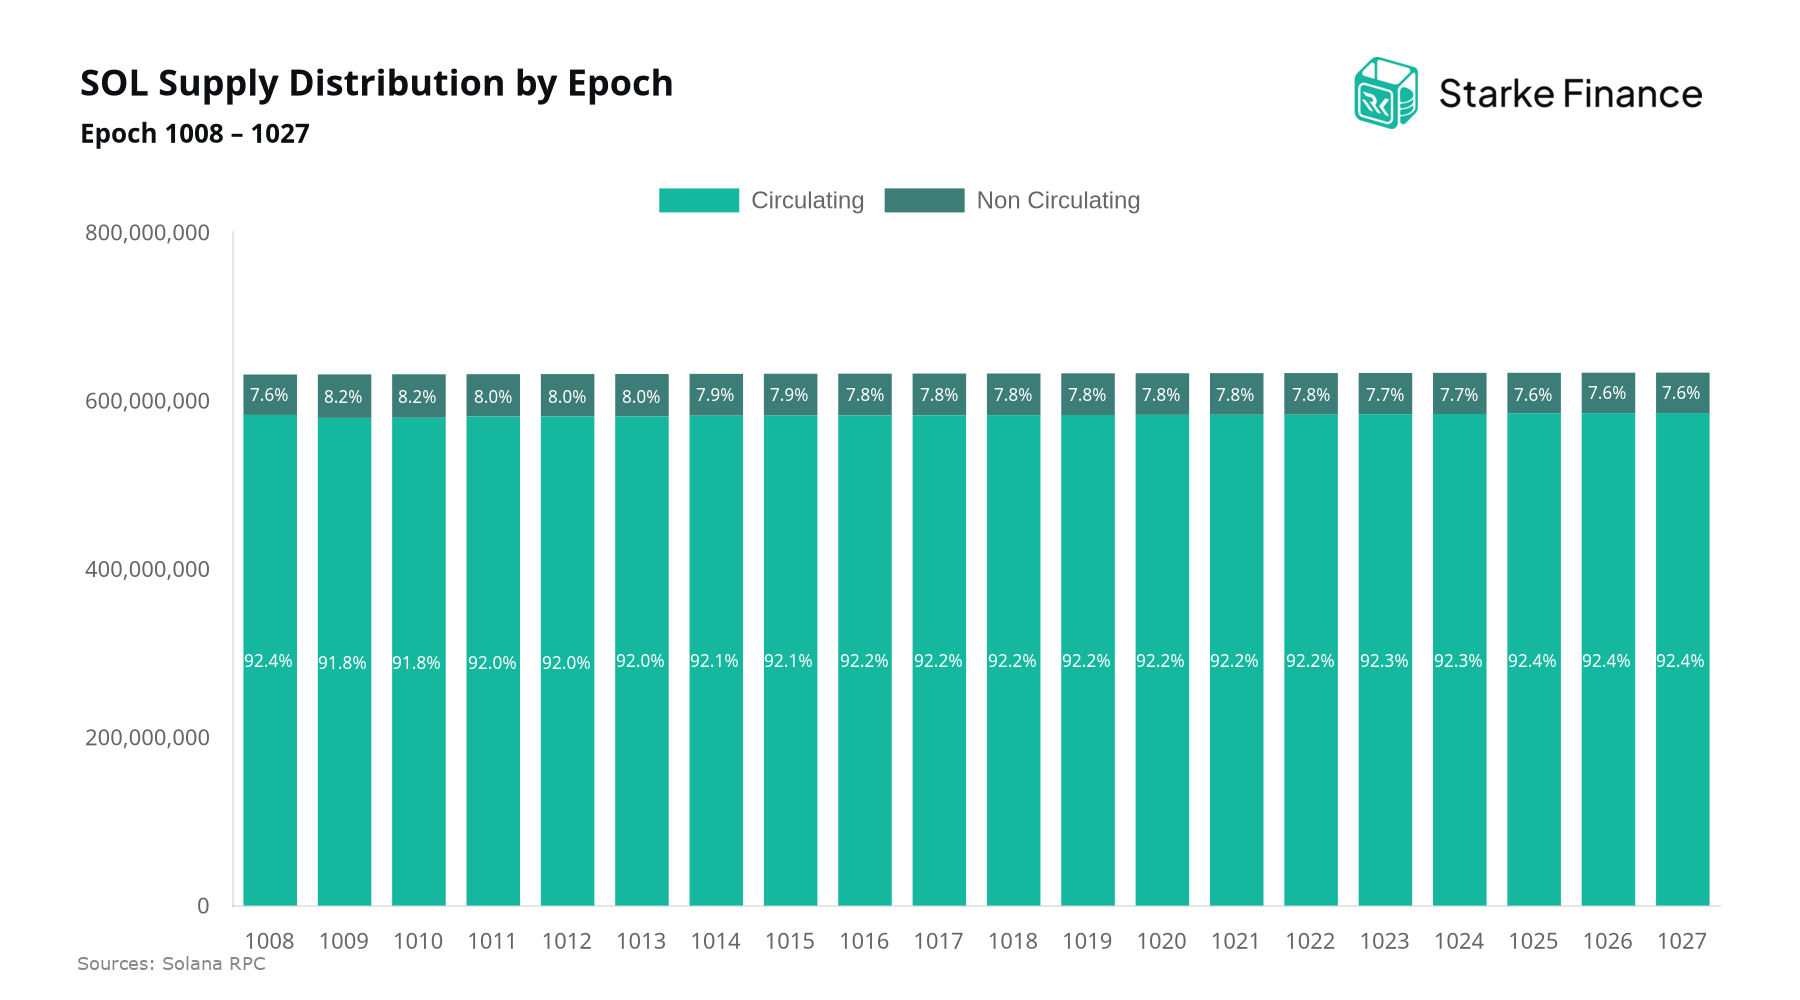
Across epochs 1008–1027, both circulating and non-circulating supply expanded, rising by 2,197,293 and 41,394 SOL respectively for a net increase of 2,238,686 SOL in total supply. As of epoch 1027, total supply stands at 633,361,797 SOL, with circulating supply accounting for 92.4% (585,292,431 SOL) and non-circulating supply 7.6% (48,069,366 SOL).
SOL Staking Ratio
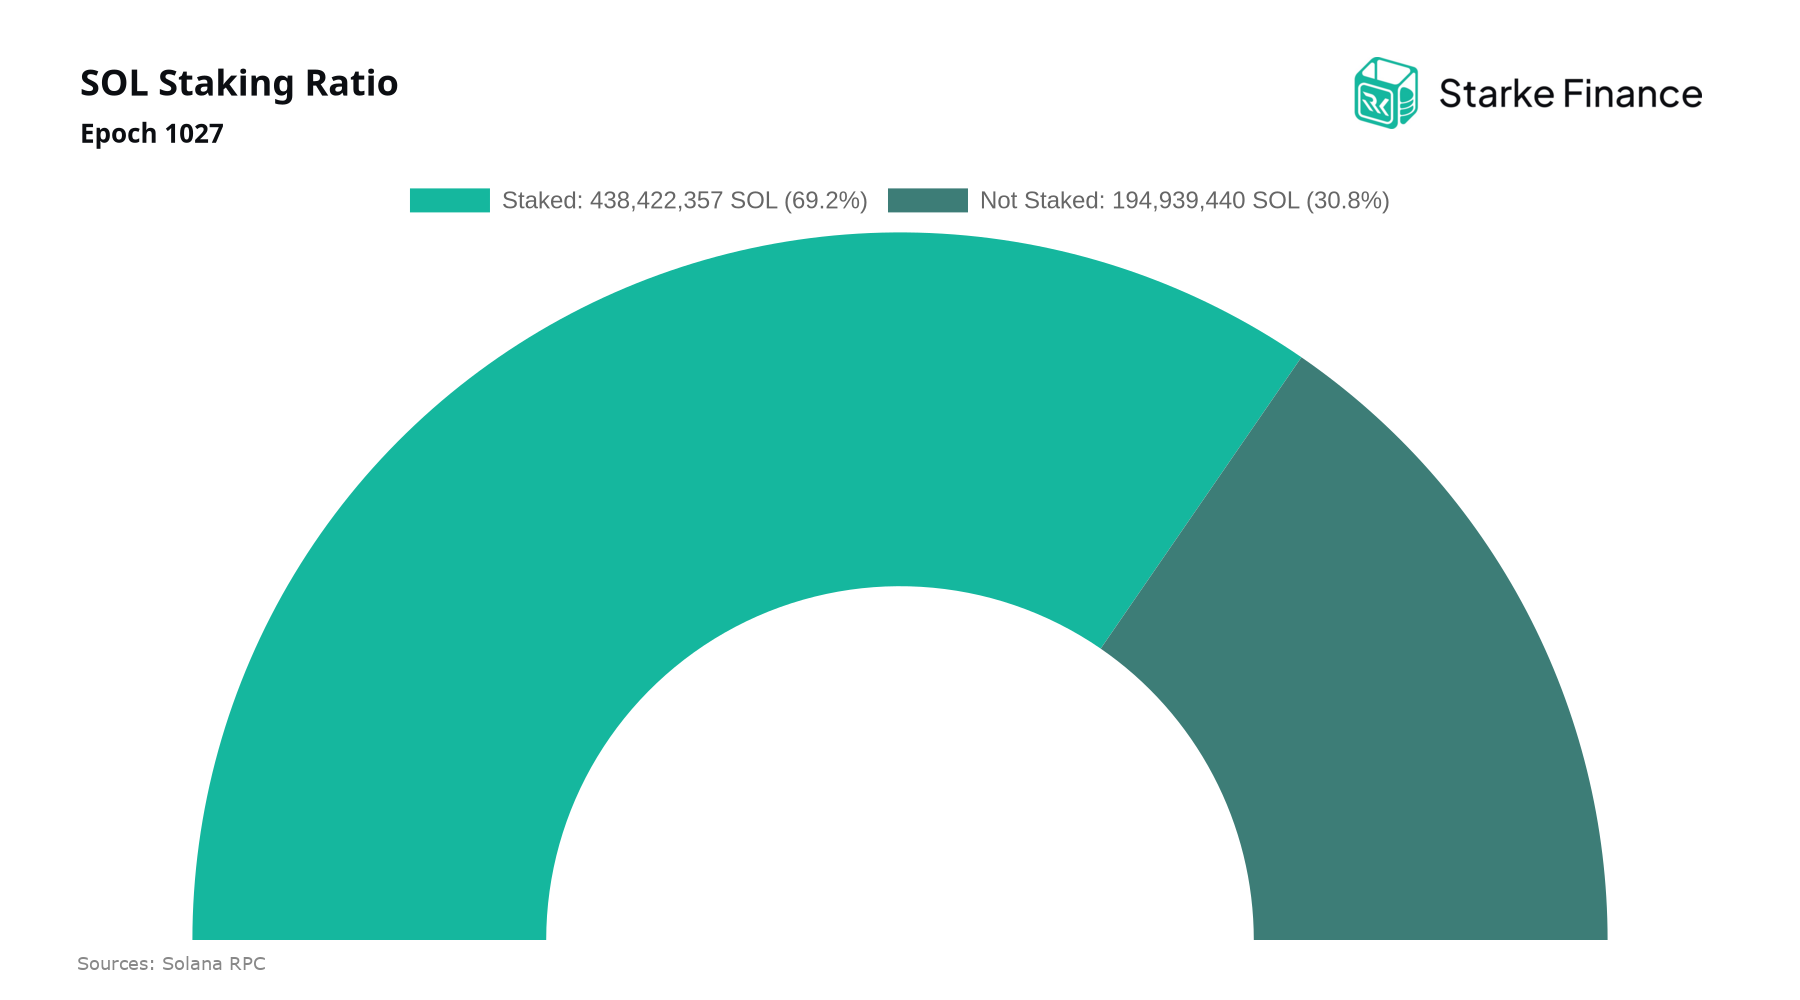
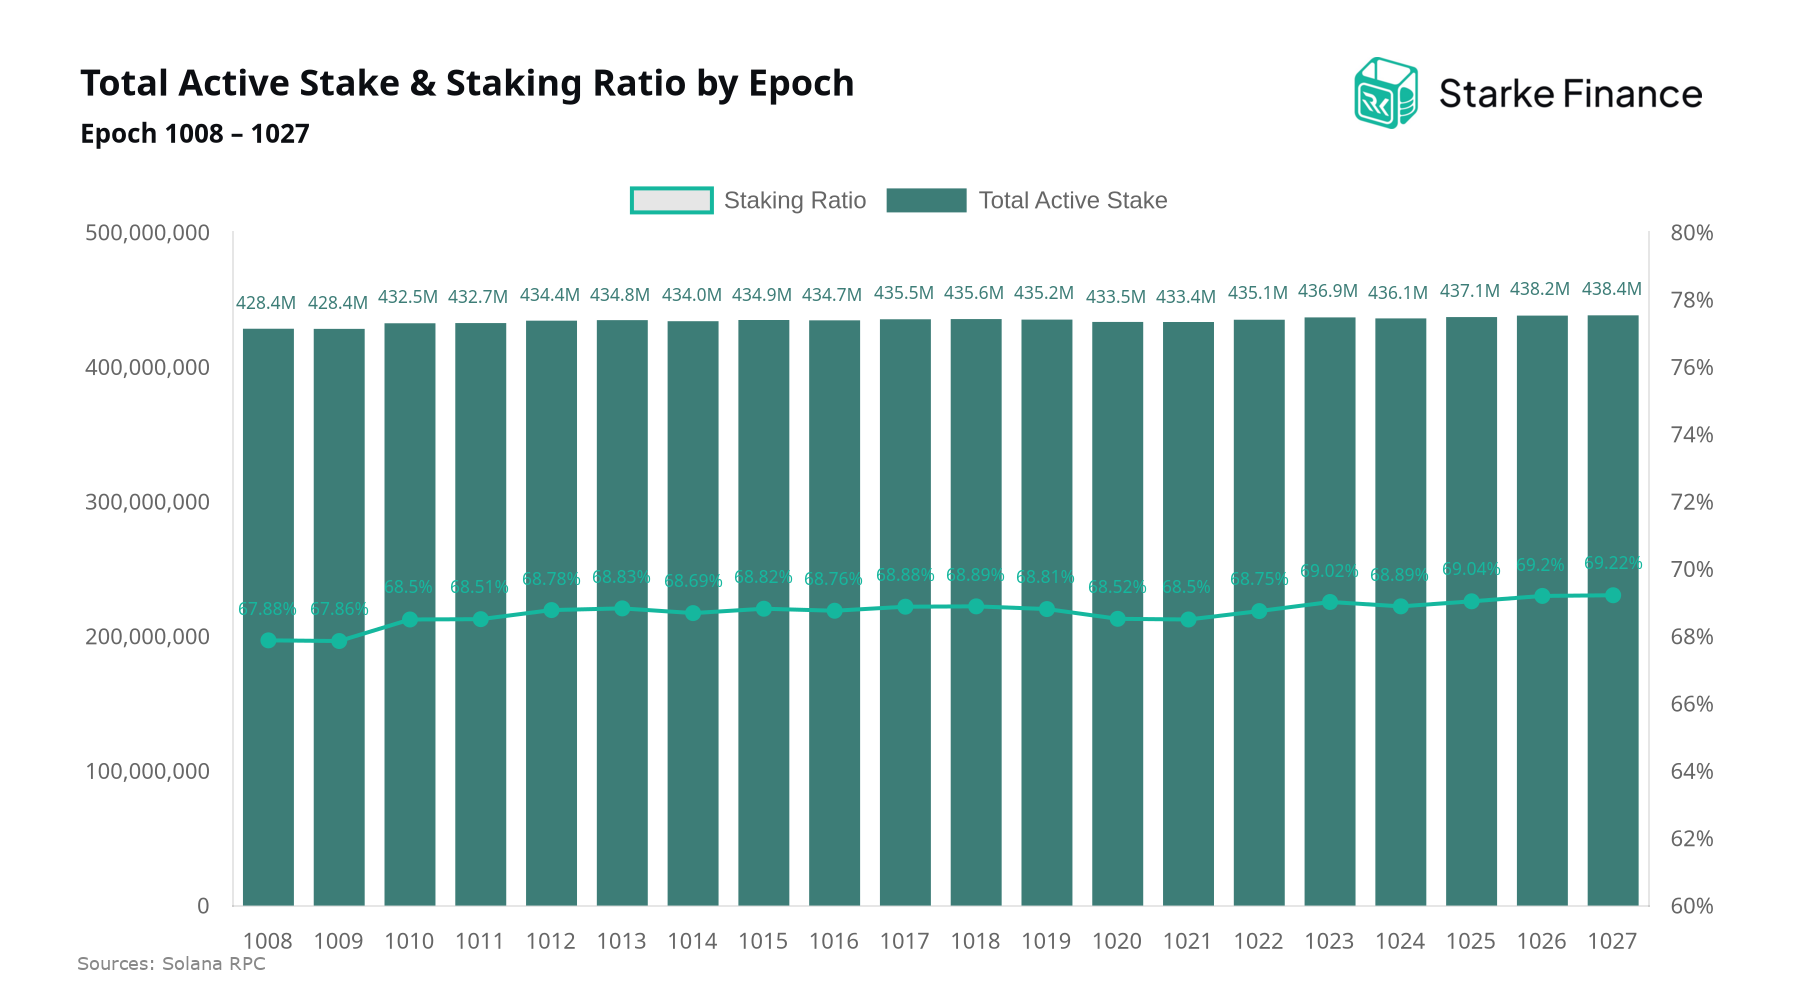
As of epoch 1027, 438,422,357 SOL is actively staked, representing 69.2% of total supply. A staking ratio at this level reflects a network where the majority of circulating SOL is committed to consensus, strengthening economic security and raising the cost of any attack on validator quorum.
Total Active Stake & Staking Ratio by Epoch
Total active stake expanded from 428,427,079 to 438,422,357 SOL between epochs 1008 and 1027, a net addition of 9,995,278 SOL. Over the same window, the staking ratio moved from 67.9% to 69.2% of circulating supply, indicating that stake growth outpaced issuance and unstaking activity.
Top 10 Stake Movements Between Cities
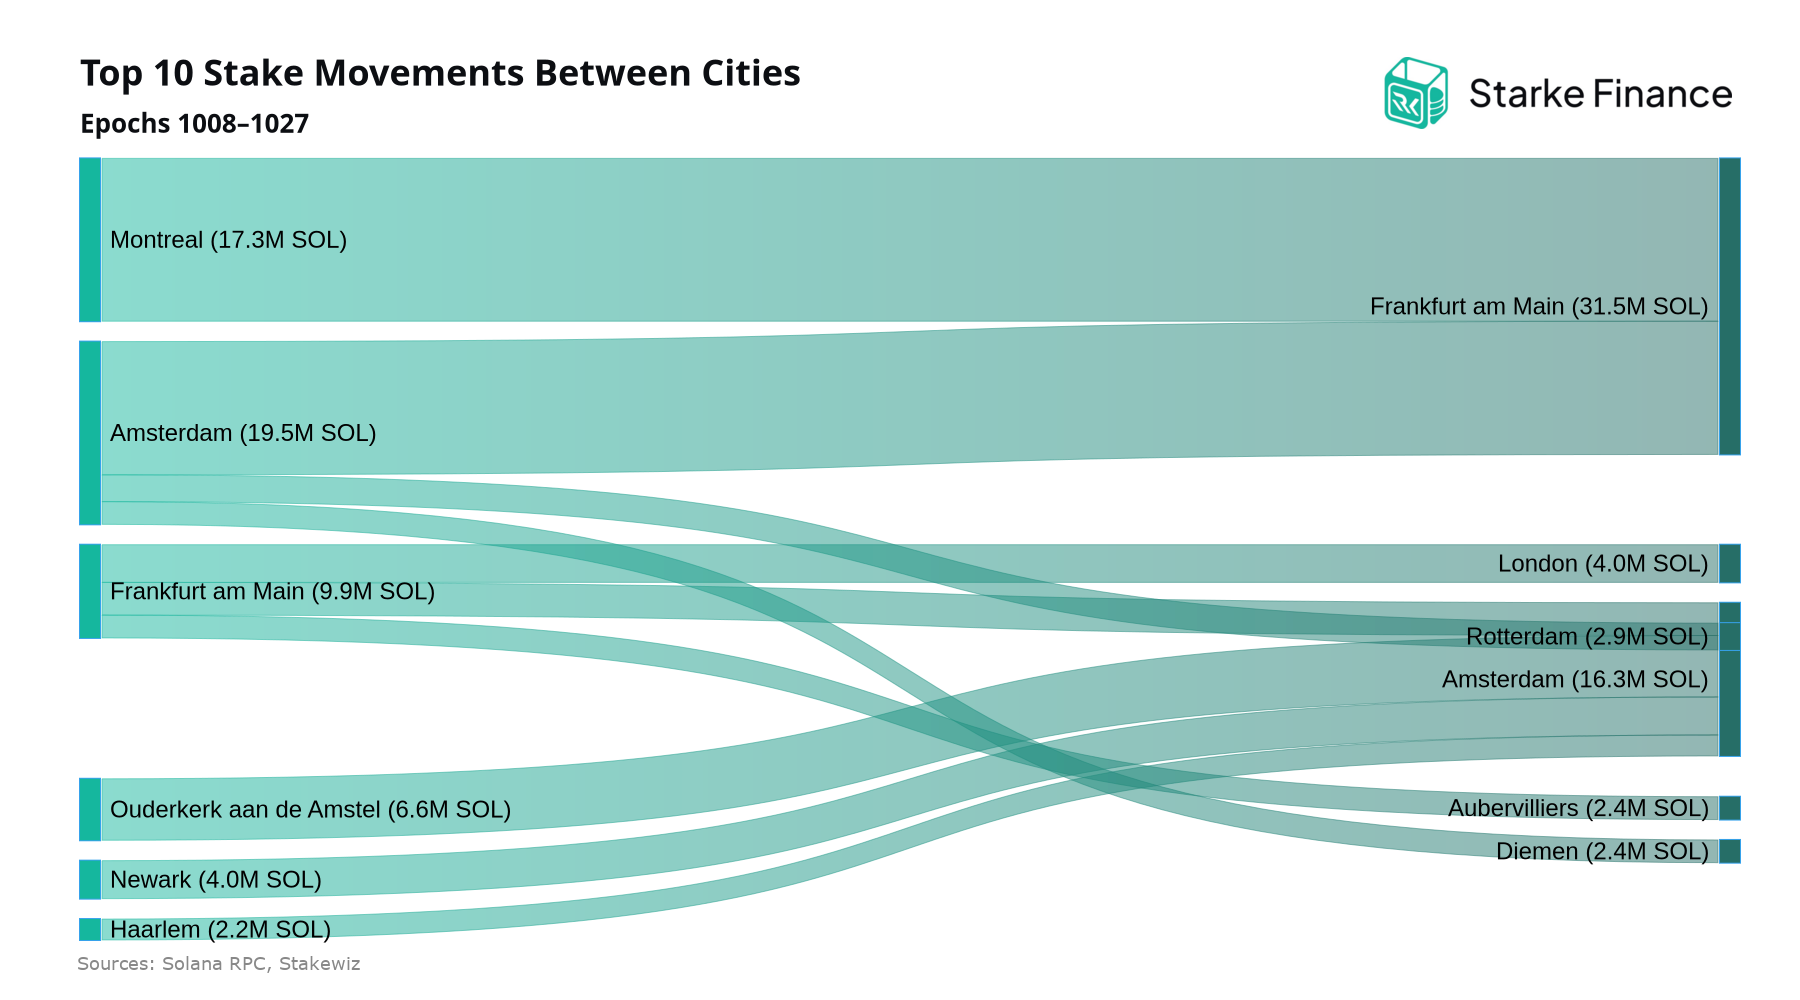
Over the last 20 epochs, the largest stake movement between cities was 17.3M SOL from Montreal to Frankfurt am Main across a single validator, followed by 14.2M SOL from Amsterdam to Frankfurt am Main across 5 validators. Both flows converge on the same destination, a pattern worth monitoring from a geographic decentralization standpoint: concentration of stake within one metropolitan area can amplify correlated risks tied to local infrastructure, connectivity, and jurisdiction, factors stakers
Top 10 Cities by Stake
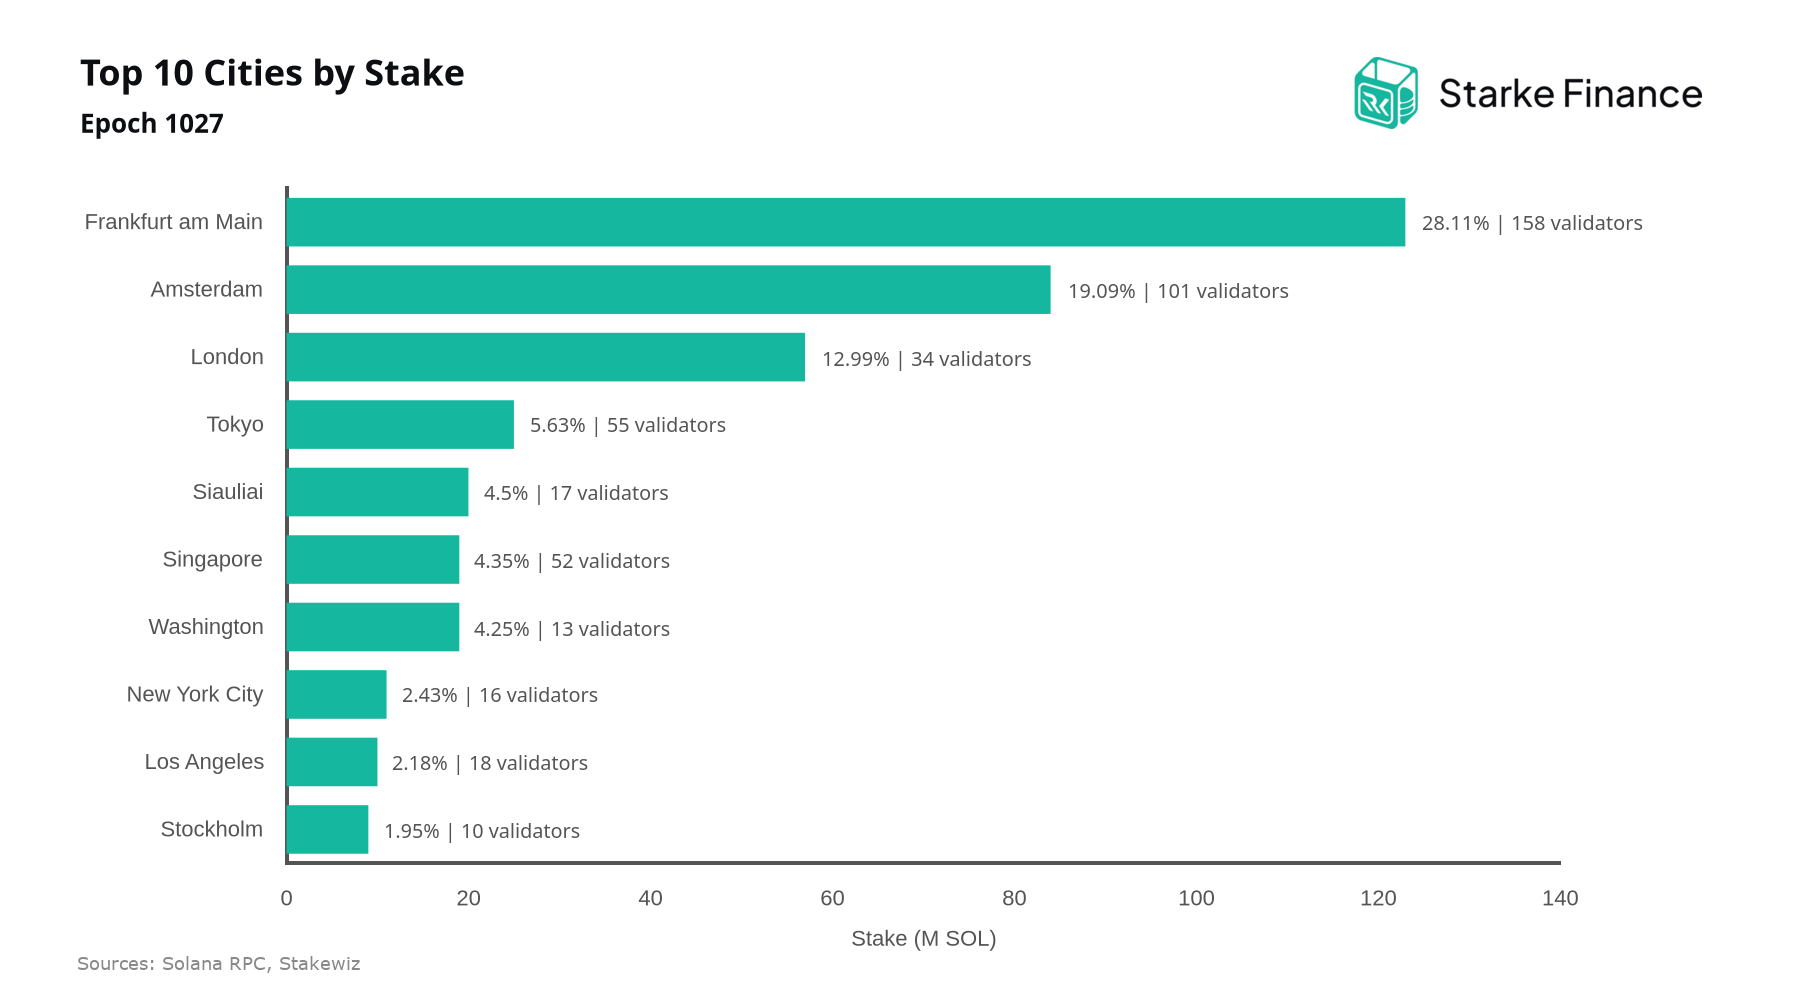
Geographic concentration of stake by city remained within a low range over the last 20 epochs, though the trend was upward, with the Herfindahl-Hirschman Index rising from 1190 to 1436. Rotterdam recorded the largest relative inflow at +1,521.3%, while Montreal saw the sharpest contraction at -96.8%.
Top 10 Stake Movements Between Countries
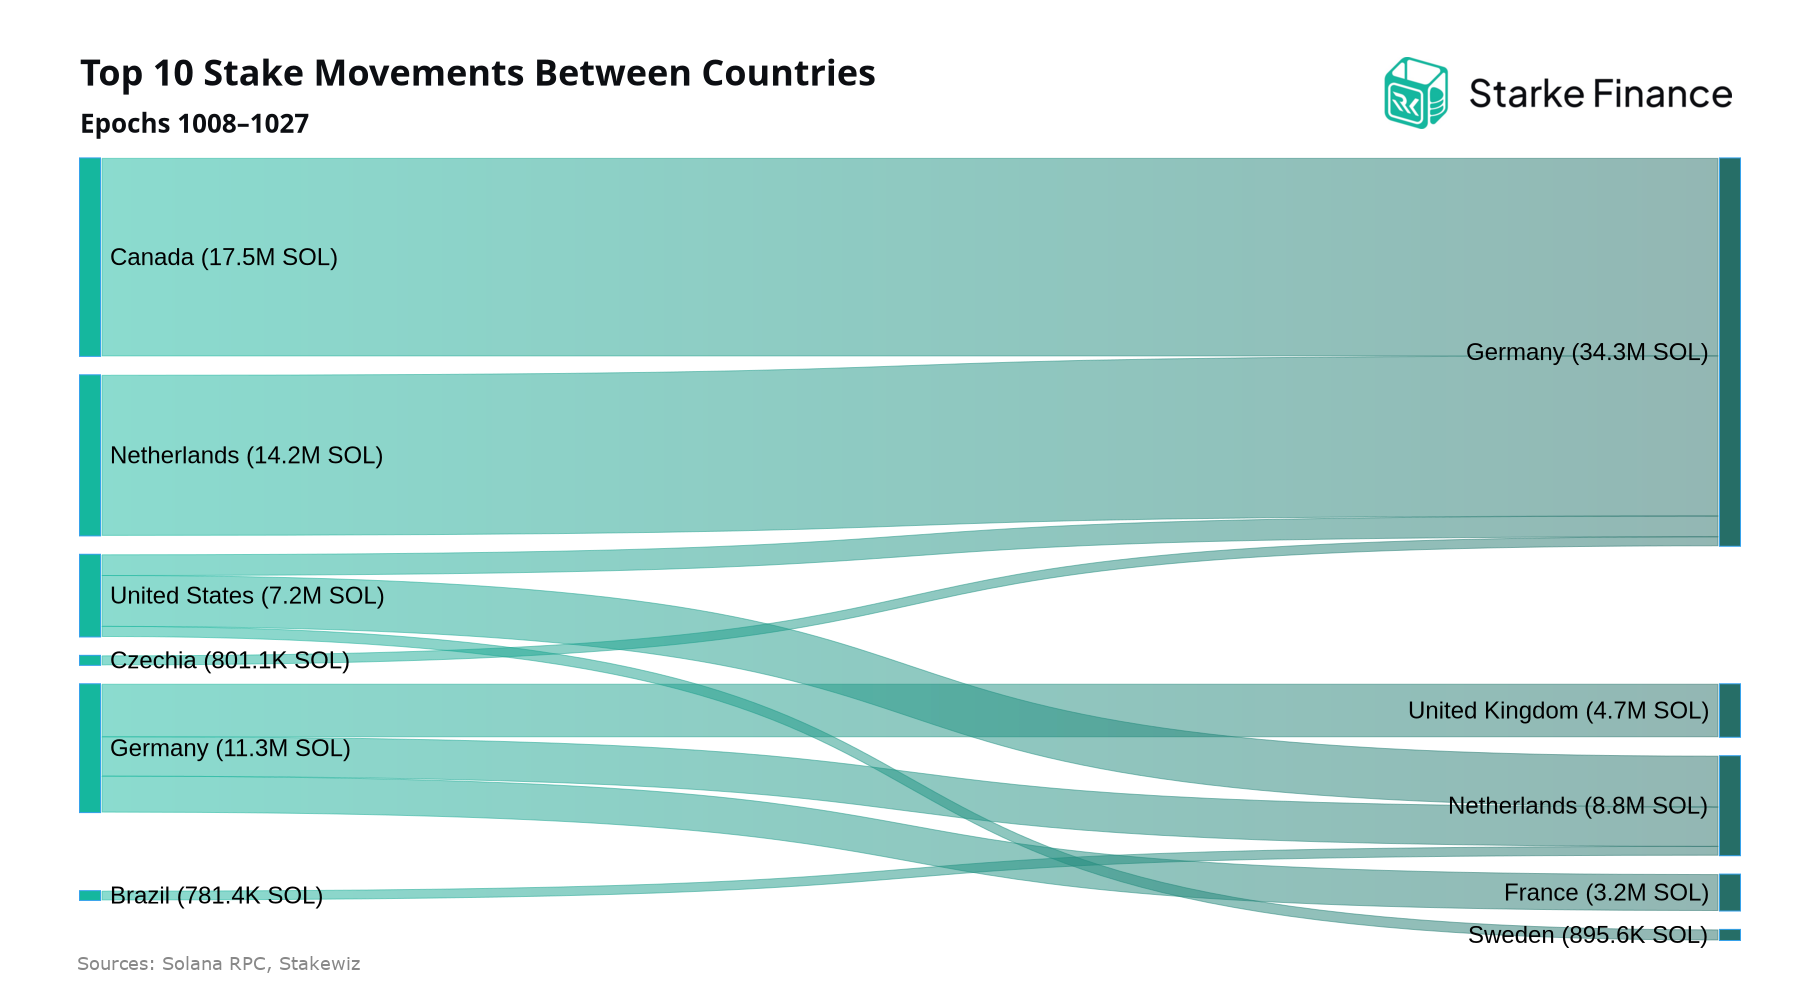
Over the last 20 epochs, the largest stake movement between countries was 17.5M SOL from Canada to Germany across 3 validators, followed by 14.2M SOL from Netherlands to Germany across 5 validators. Cross-border flows of this scale reflect operator-level decisions on hosting, jurisdiction, and infrastructure rather than delegator behavior, and warrant monitoring: sustained concentration into a single jurisdiction can gradually erode the geographic diversity that underpins Solana's resilience and
Top 10 Countries by Stake
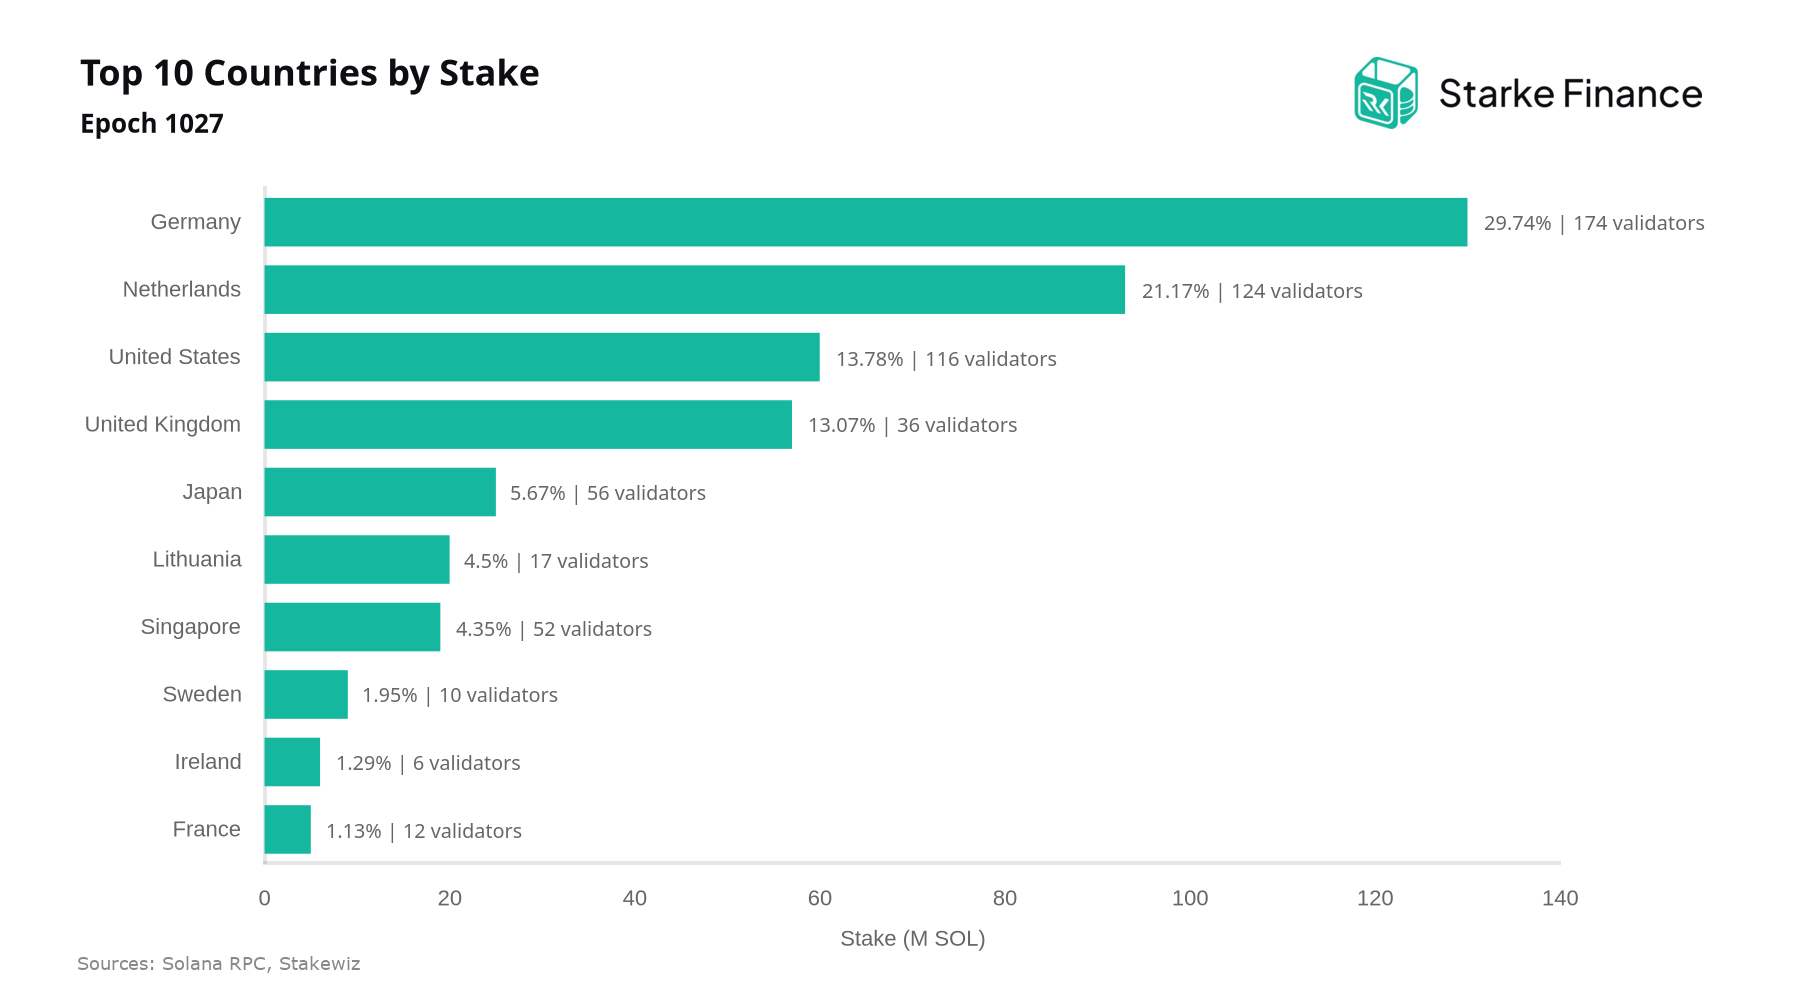
Geographic distribution of stake is a core input to Solana's resilience, since jurisdictional concentration exposes the network to correlated regulatory and infrastructure risk. Over the last 20 epochs, country-level concentration remained moderate but drifted higher, with the HHI rising from 1,584 to 1,773. France posted the largest gain at +133.2%, while Czechia saw the sharpest decline at -88.1%.
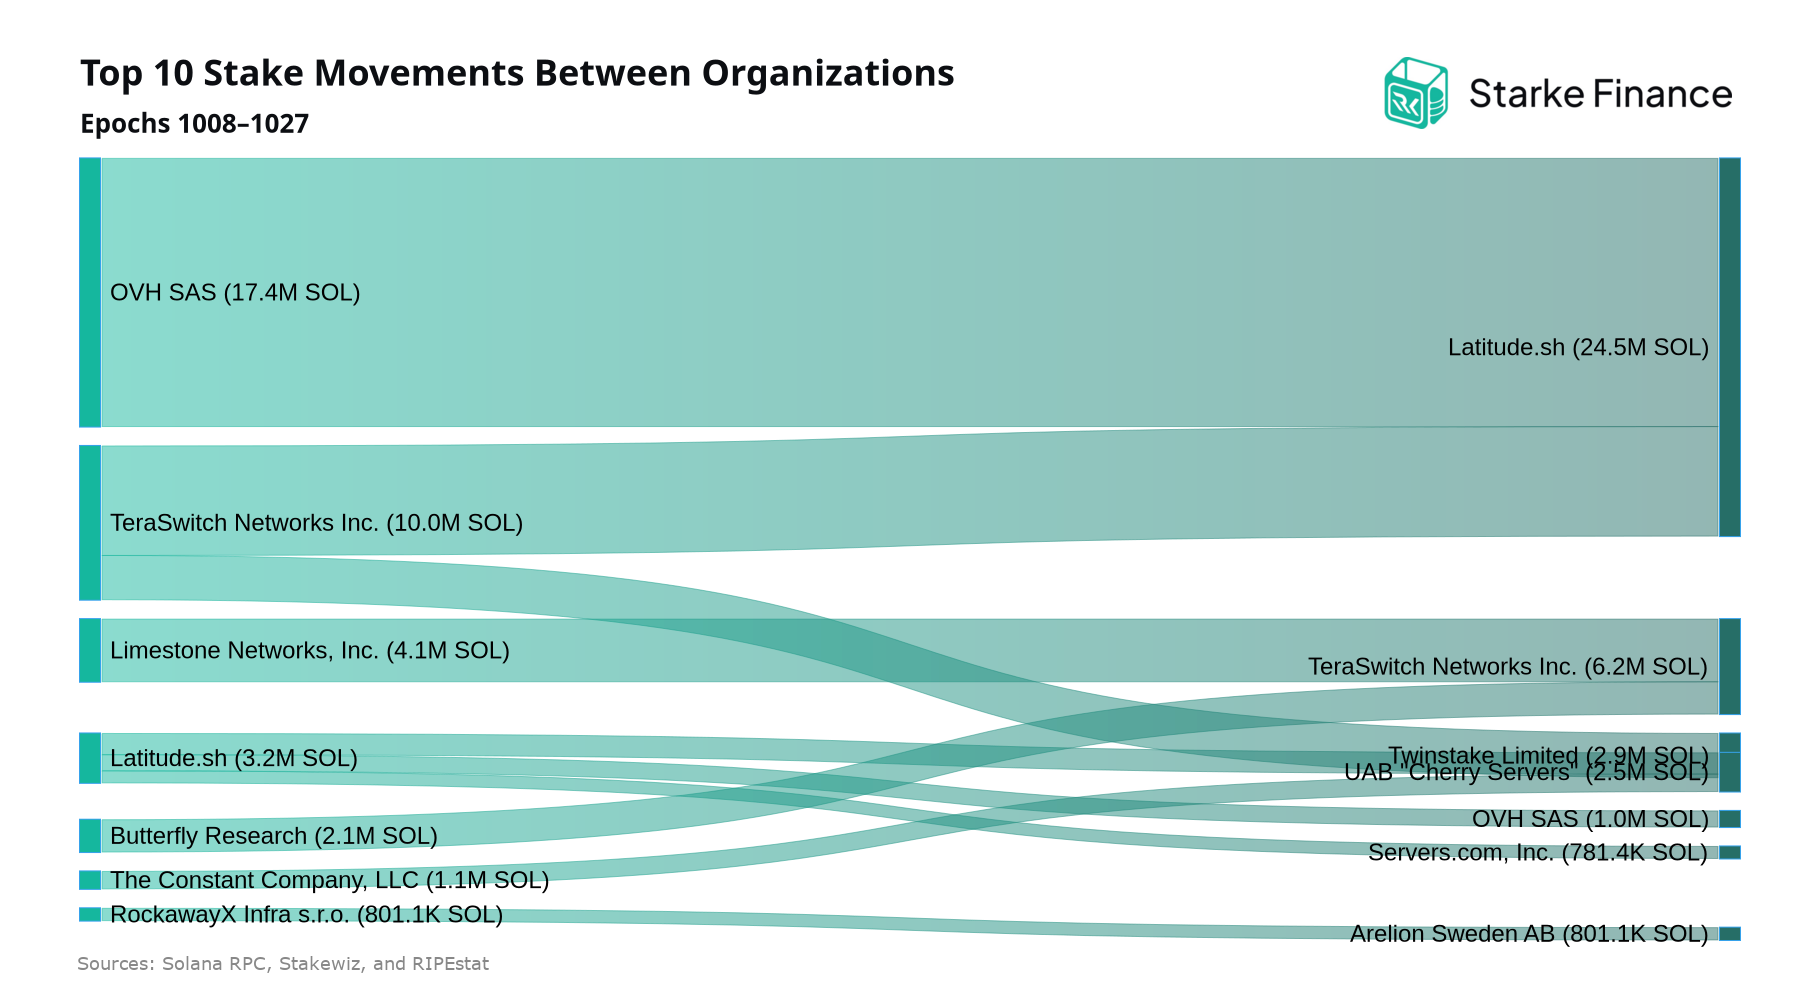
Top 10 Stake Movements Between Organizations
Over the last 20 epochs, the largest stake movement between organizations was 17.4M SOL from OVH SAS to Latitude.sh across 2 validators, followed by 7.1M SOL from TeraSwitch Networks Inc. to Latitude.sh across 3 validators. Inter-organization flows of this magnitude reshape the hosting-provider concentration profile of the network, a key input when assessing infrastructure-level correlation risk.
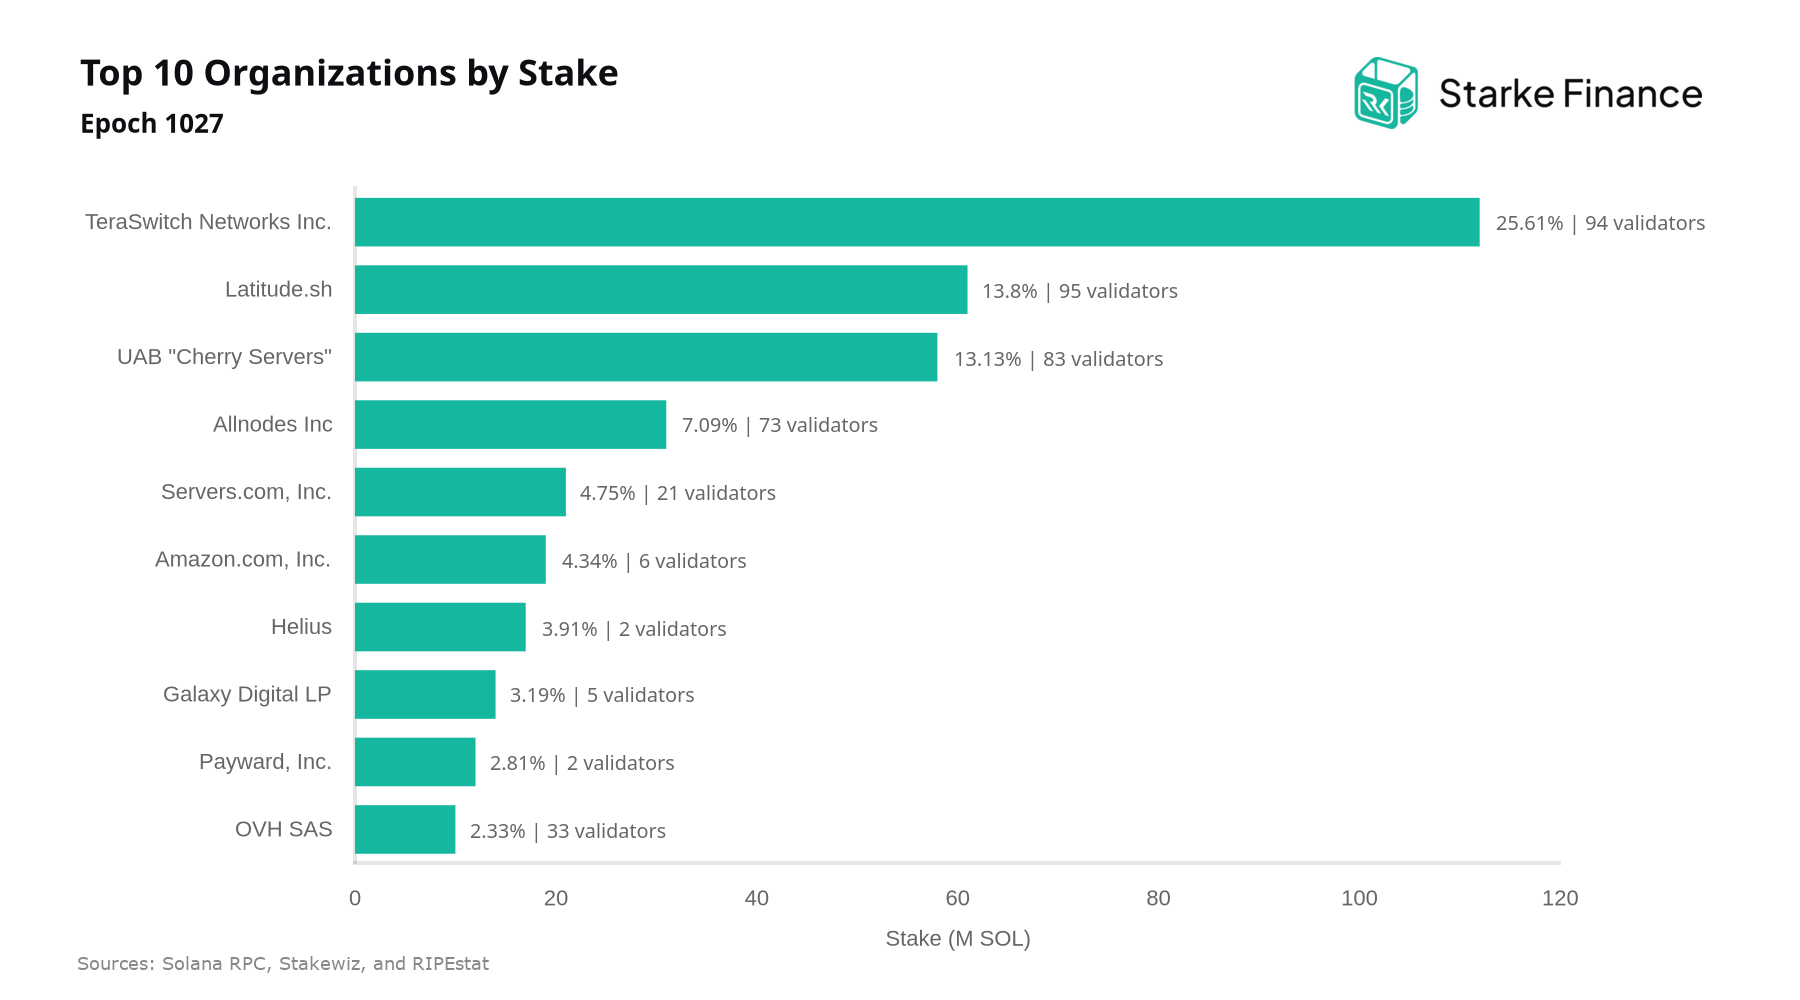
Top 10 Organizations by Stake
Concentration among the largest hosting and infrastructure organizations supporting Solana validators remains modest but has drifted higher over the last 20 epochs, with the HHI rising from 1,144 to 1,171. Compositional shifts were more pronounced than the headline number suggests: Arelion Sweden AB posted the largest stake increase at +636.3%, while RockawayX Infra s.r.o. recorded the sharpest decline at -90.7%. At the top of the distribution, TeraSwitch Networks Inc.
Maximize your Solana rewards with Starke Finance
- Higher yield potential: optimized validator selection built to capture more of Solana's staking rewards.
- Zero fees: we don't take a cut of your staking rewards.
- Transparency & control: track your stake and rewards in real time.
- Reliable infrastructure: institutional-grade validator operations built for uptime.
Disclaimer
This report is provided for informational purposes only and does not constitute investment, legal, or tax advice. Staking involves risk, including the risk of loss and slashing. Past performance is not indicative of future results. Please do your own research and consult a professional advisor before making financial decisions.
Contributors

Oscar GarciaFounder & CEO