staking
Solana Decentralization Report — September 2026
A data-driven look at Solana validator decentralization for September 2026: stake concentration, geographic and client diversity, and validator movement trends.

Estimated Reading Time: 7 minutes
Summary
This month's Solana Decentralization Report covers 23 key metrics across validator concentration, geographic and client diversity, and stake movement trends for September 2026. Read on for the full breakdown, chart by chart.
Net Stake Change by Validator Size
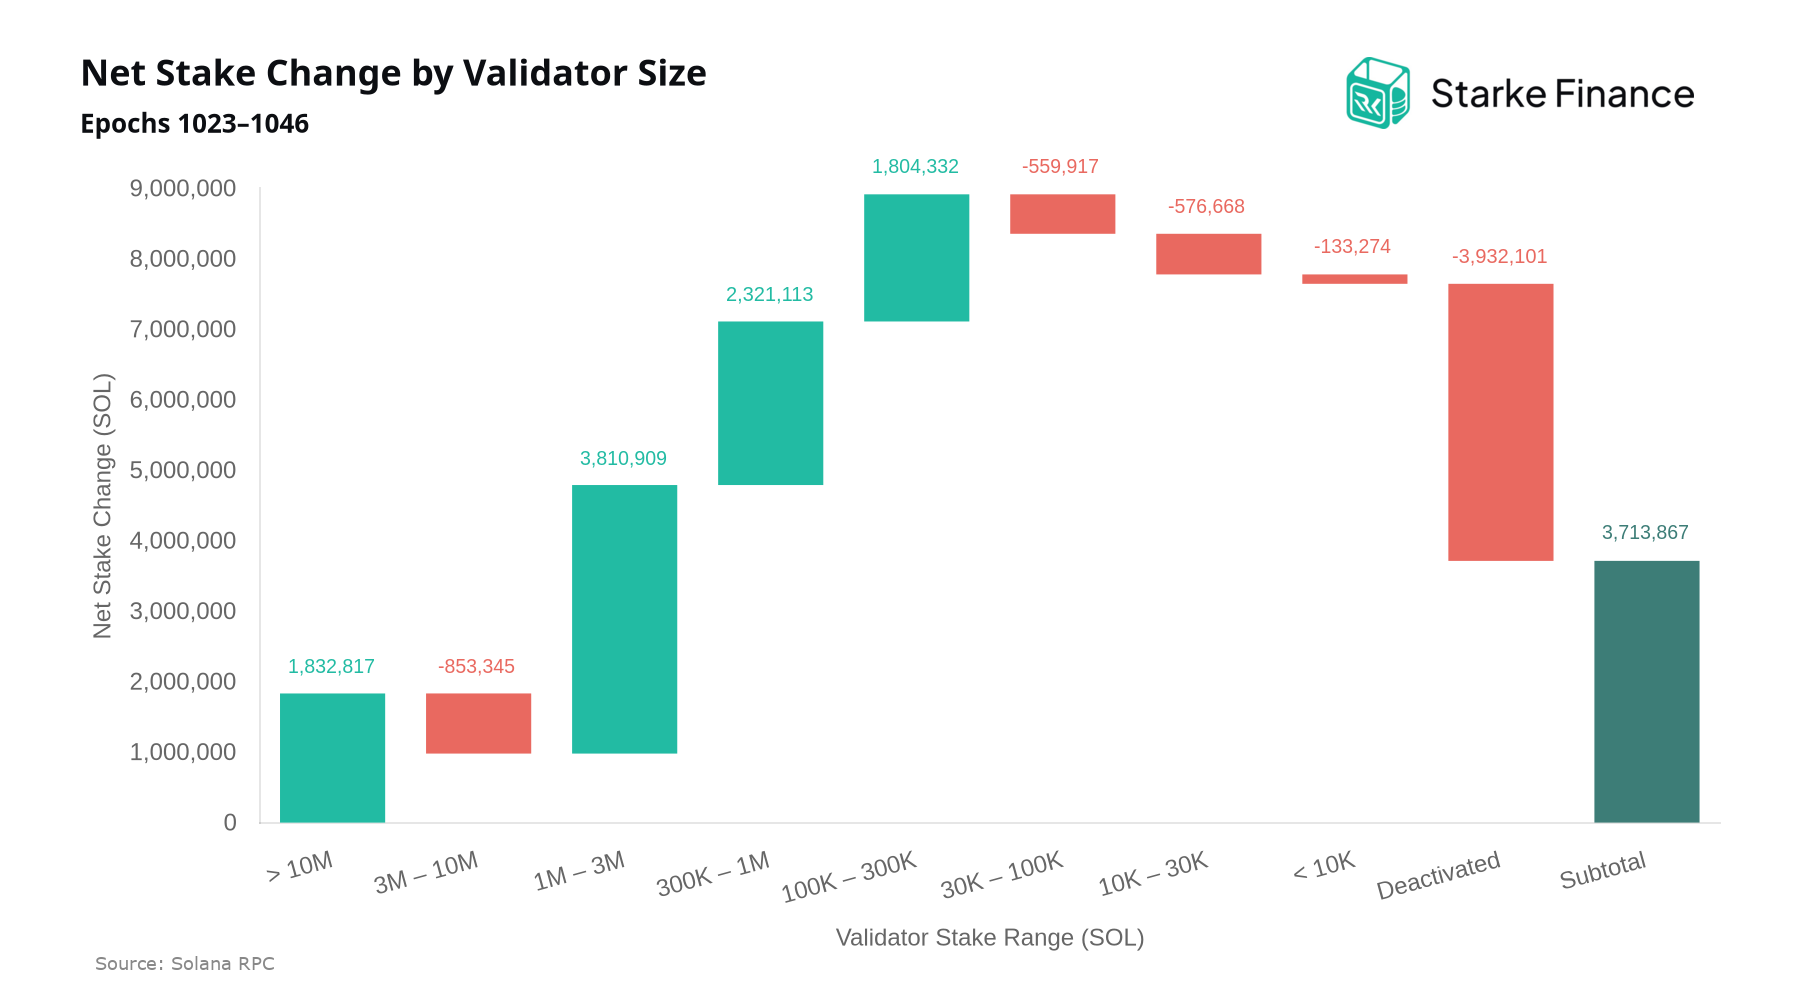
Over the past 23 epochs (roughly 30 days), net staked SOL rose by approximately 3.7M SOL, with the bulk of inflows concentrated in mid-sized validators holding between 1M and 3M SOL, which captured around 3.8M SOL in net new stake. The largest offsetting movement came from deactivated validators, which shed roughly 3.9M SOL as delegators redirected capital.
Solana Stake Distribution Lorenz Curve
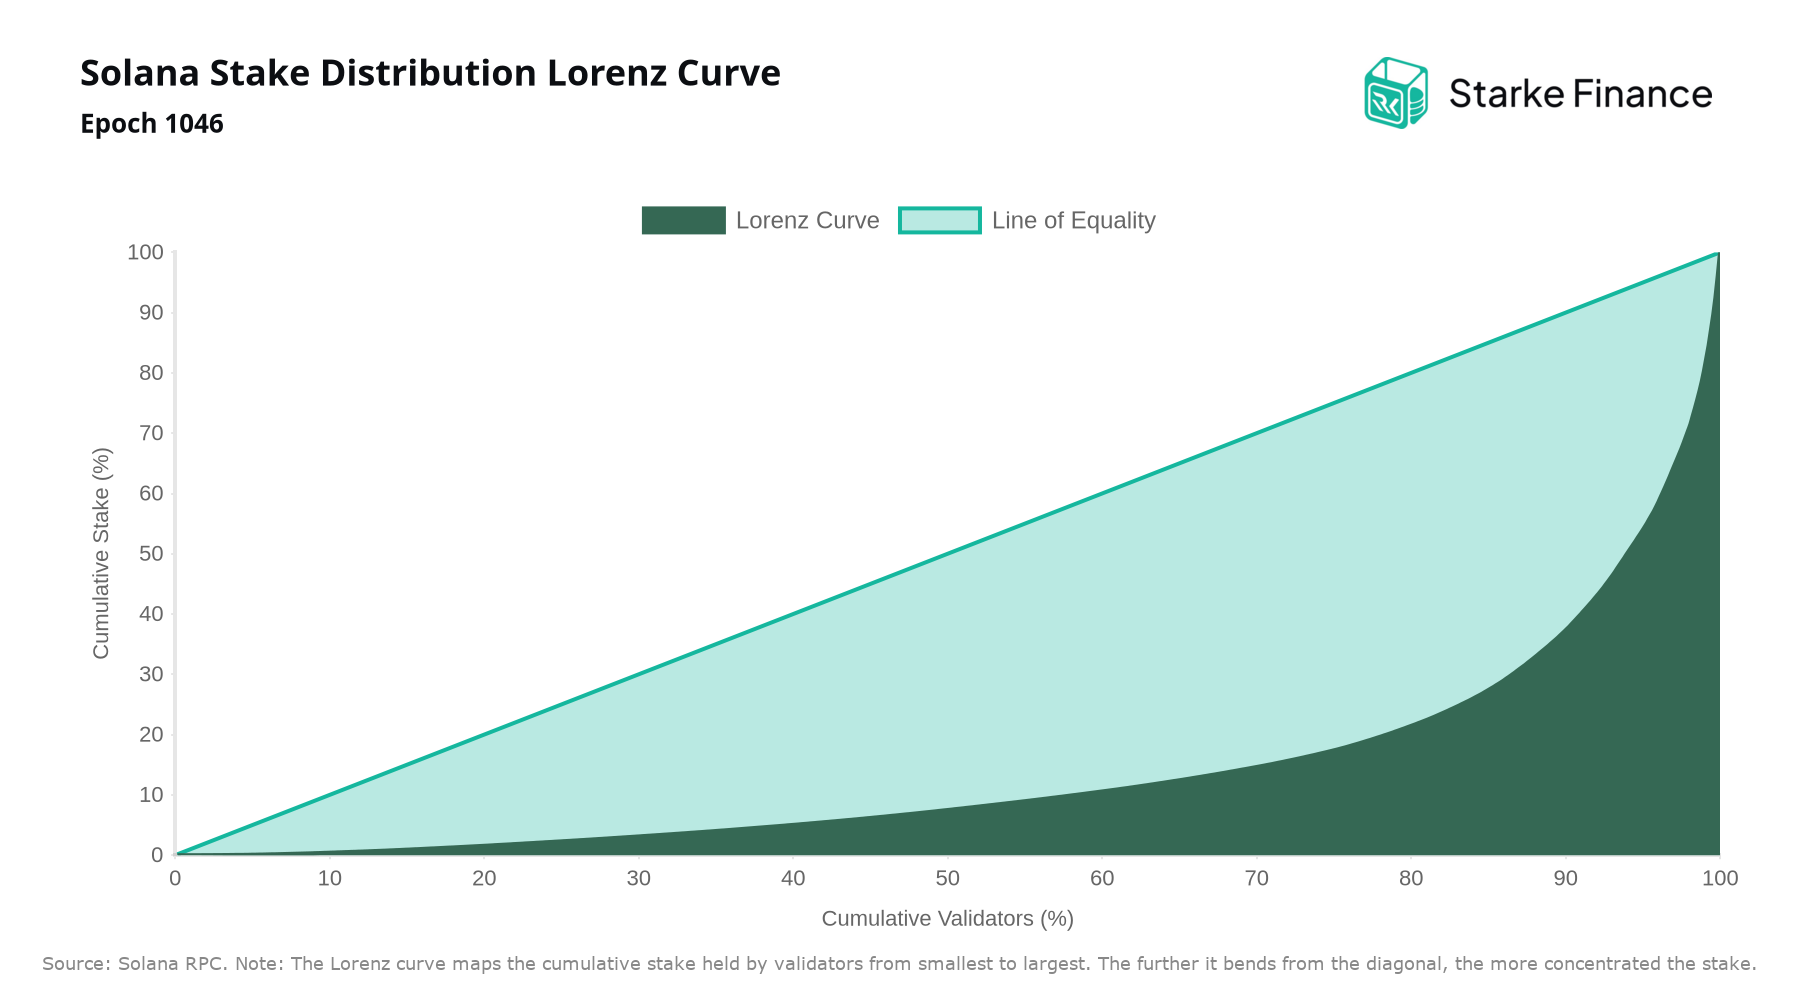
The Lorenz curve plots the cumulative share of stake against the cumulative share of validators, with the Gini coefficient summarising how far the distribution departs from perfect equality. A theoretical maximum of 1 at epoch 1046 would imply a single validator controlling all stake, while 0 would indicate every validator holding an identical share.
Solana Stake Control Thresholds
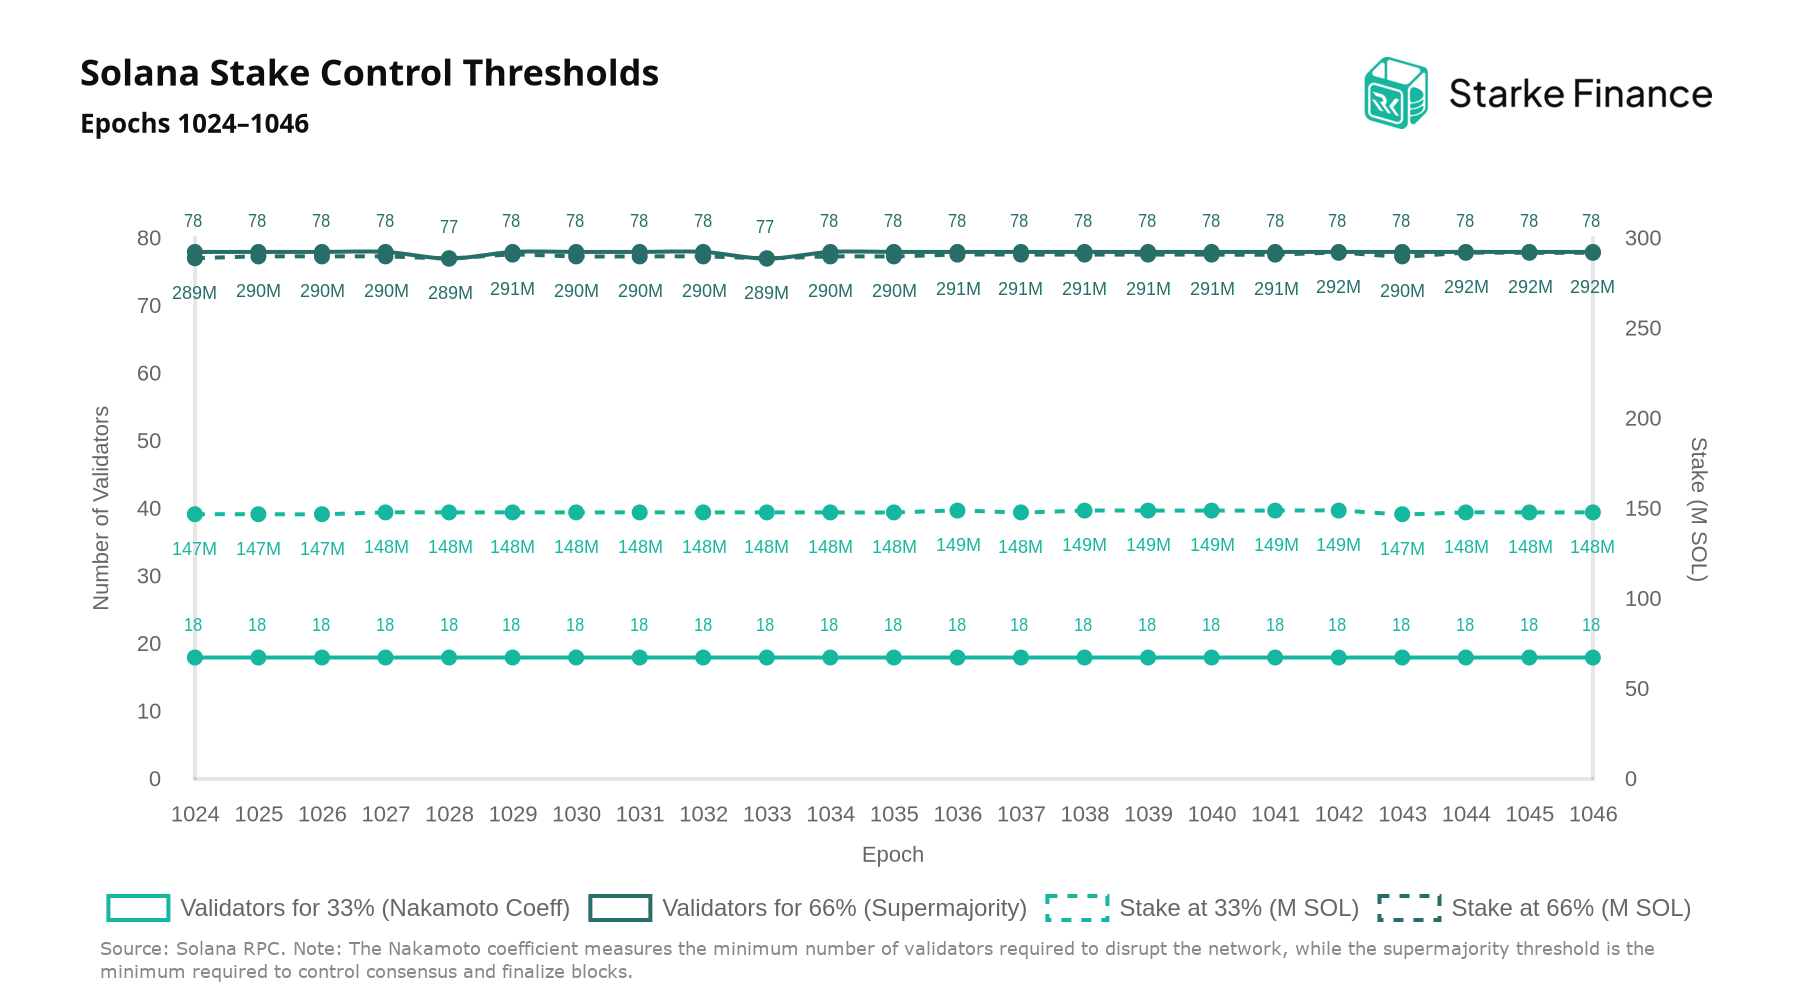
Solana's Nakamoto coefficient held steady at 18 validators over the last 23 epochs, meaning the minimum number of colluding operators required to halt consensus has not shifted. The supermajority threshold, representing the validators controlling two-thirds of active stake, likewise remained at 78.
Stake Concentration: Herfindahl-Hirschman Index (HHI)
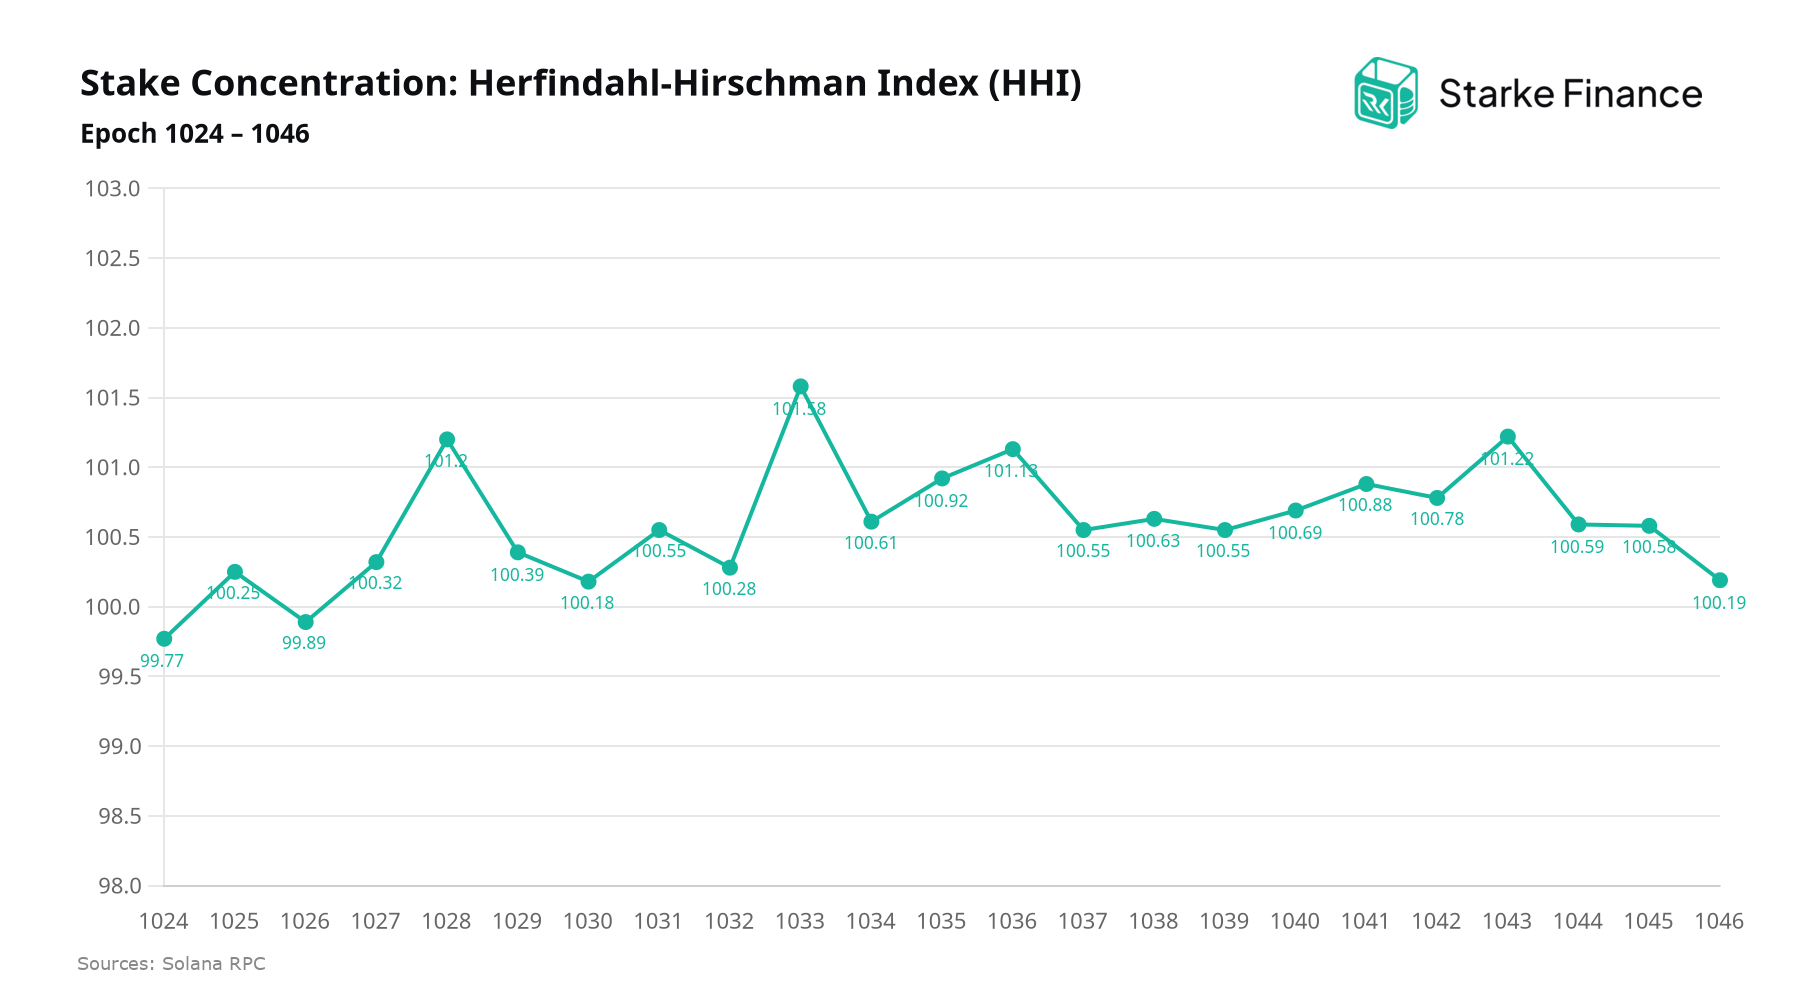
While the Gini coefficient captures inequality across the distribution, the Herfindahl-Hirschman Index measures effective concentration, reflecting how many validators meaningfully contribute to total stake. Between epoch 1024 and 1046, HHI fluctuated in a narrow band of 99.77 to 101.58, pointing to a stable and broad validator base.
Stake Share by Top Staked Validators
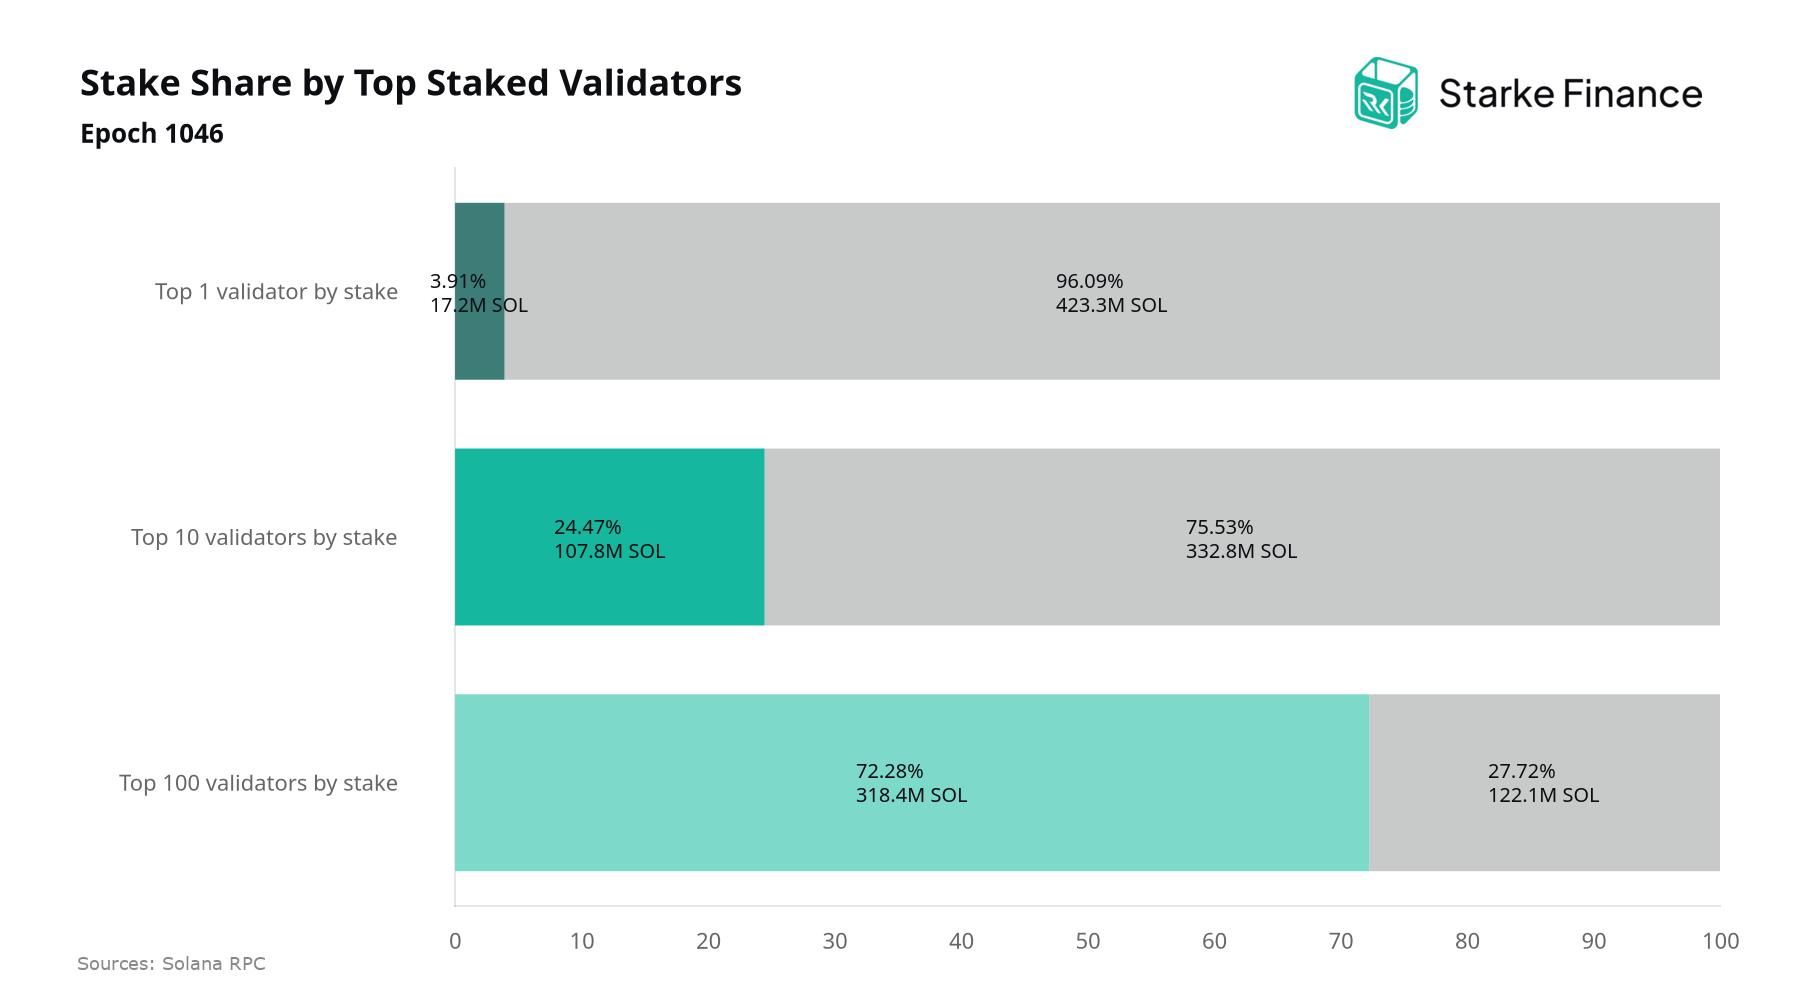
At epoch 1046, the top staked validator holds 3.91% of total stake (17.2M SOL), the top 10 account for 24.47% (107.8M SOL), and the top 100 for 72.28% (318.4M SOL). The absence of any single dominant operator is a positive signal for censorship resistance, though the concentration within the top 100 underscores why stake delegation decisions matter: stakers directing flows toward smaller, performant validators directly strengthen the network's resilience and Nakamoto coefficient over time.
Stake Share by Top Staked Validators per Epoch
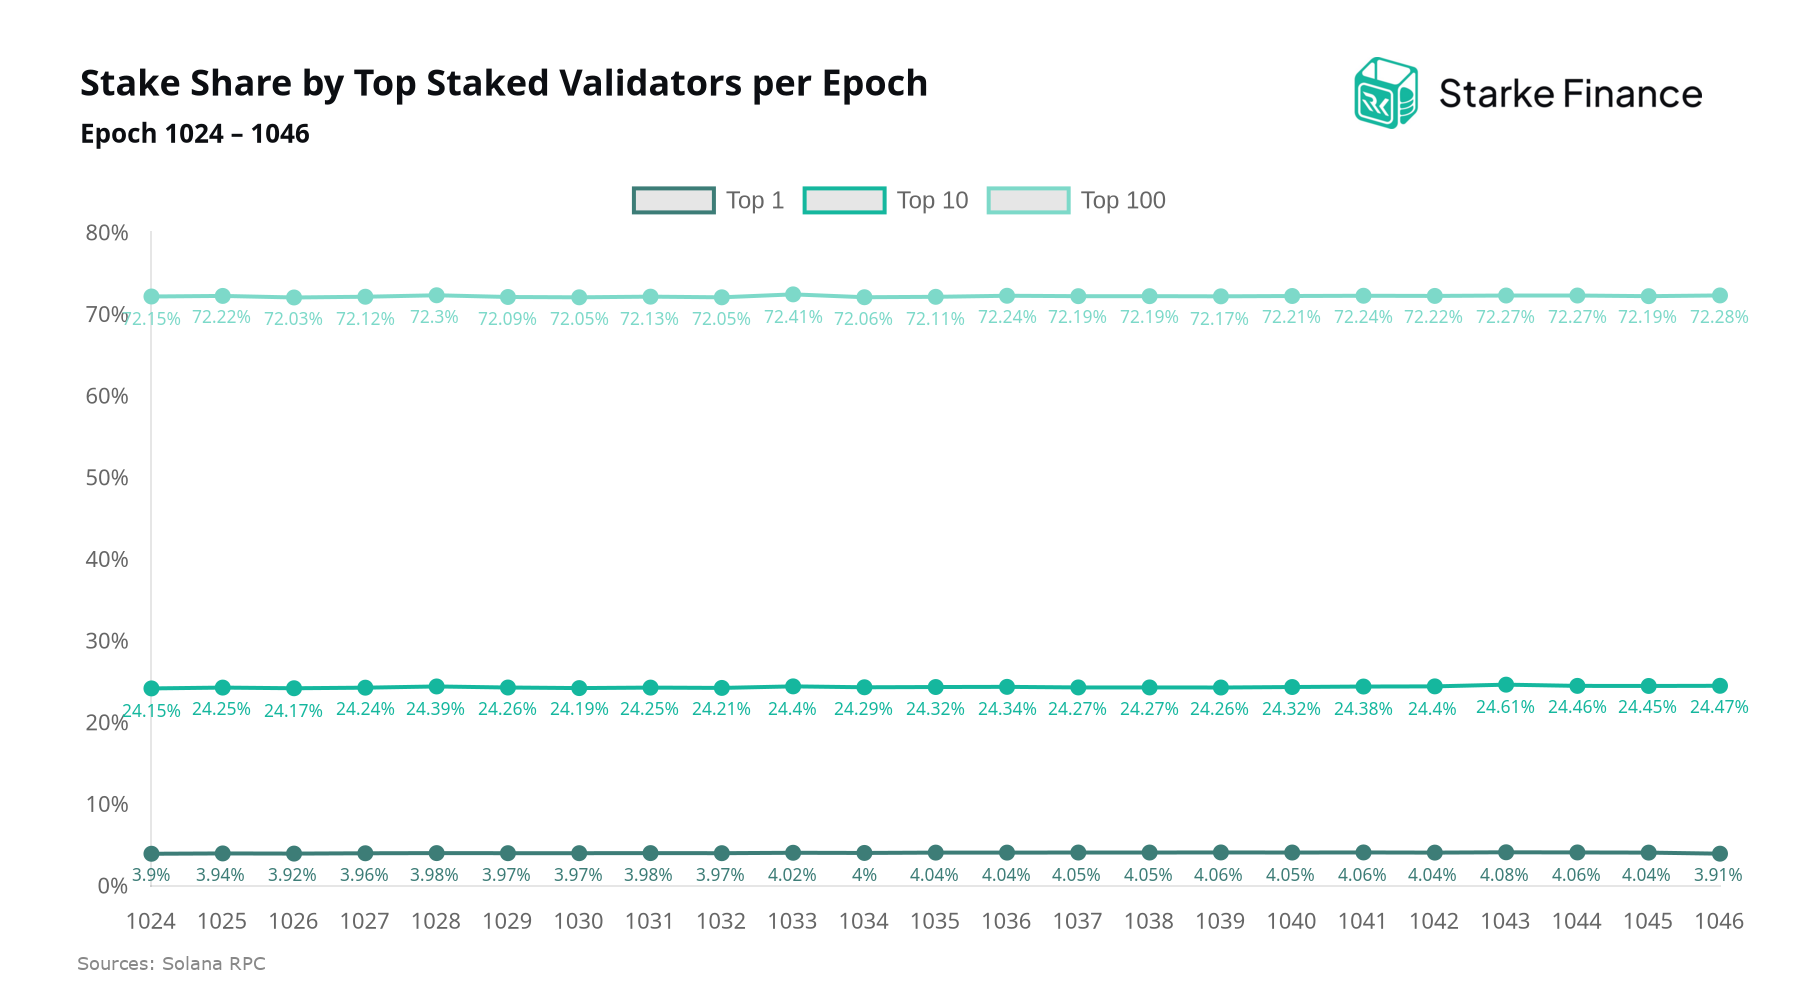
Across epochs 1024–1046, stake concentration among the largest validators drifted modestly higher at every tier measured. The top staked validator edged from 3.9% to 3.91%, the top 10 from 24.15% to 24.47%, and the top 100 from 72.15% to 72.28%. The movements are small in absolute terms, but the uniform direction warrants attention: for stakers assessing network resilience, a persistent concentration trend among leading operators gradually narrows the validator set that underpins consensus and l
Validator Count by Epoch
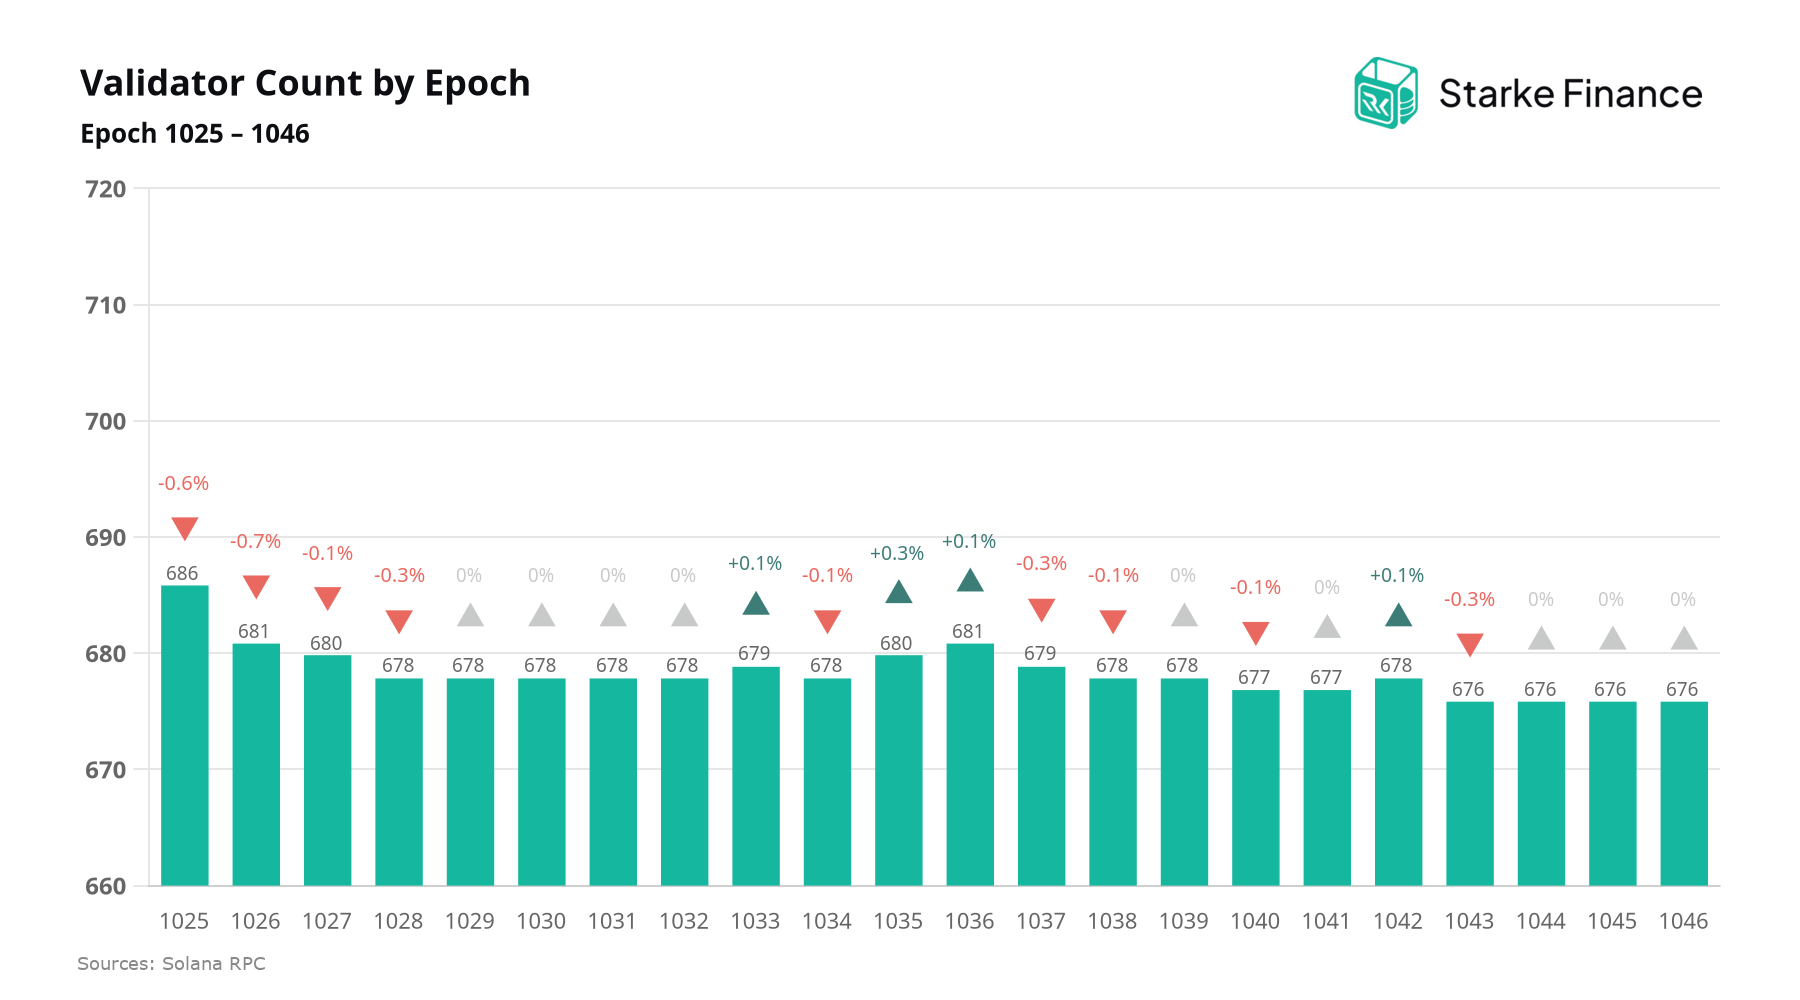
The active validator set contracted from 686 to 676 across epochs 1025–1046, a net decline of 1.5%, with the sharpest single-epoch drop of 0.7% occurring at epoch 1026. While modest in absolute terms, a shrinking operator base warrants attention from a decentralization standpoint, as fewer independent validators can gradually concentrate stake and consensus influence.
Number of Validators Gaining, Losing and Stable Stake by Epoch
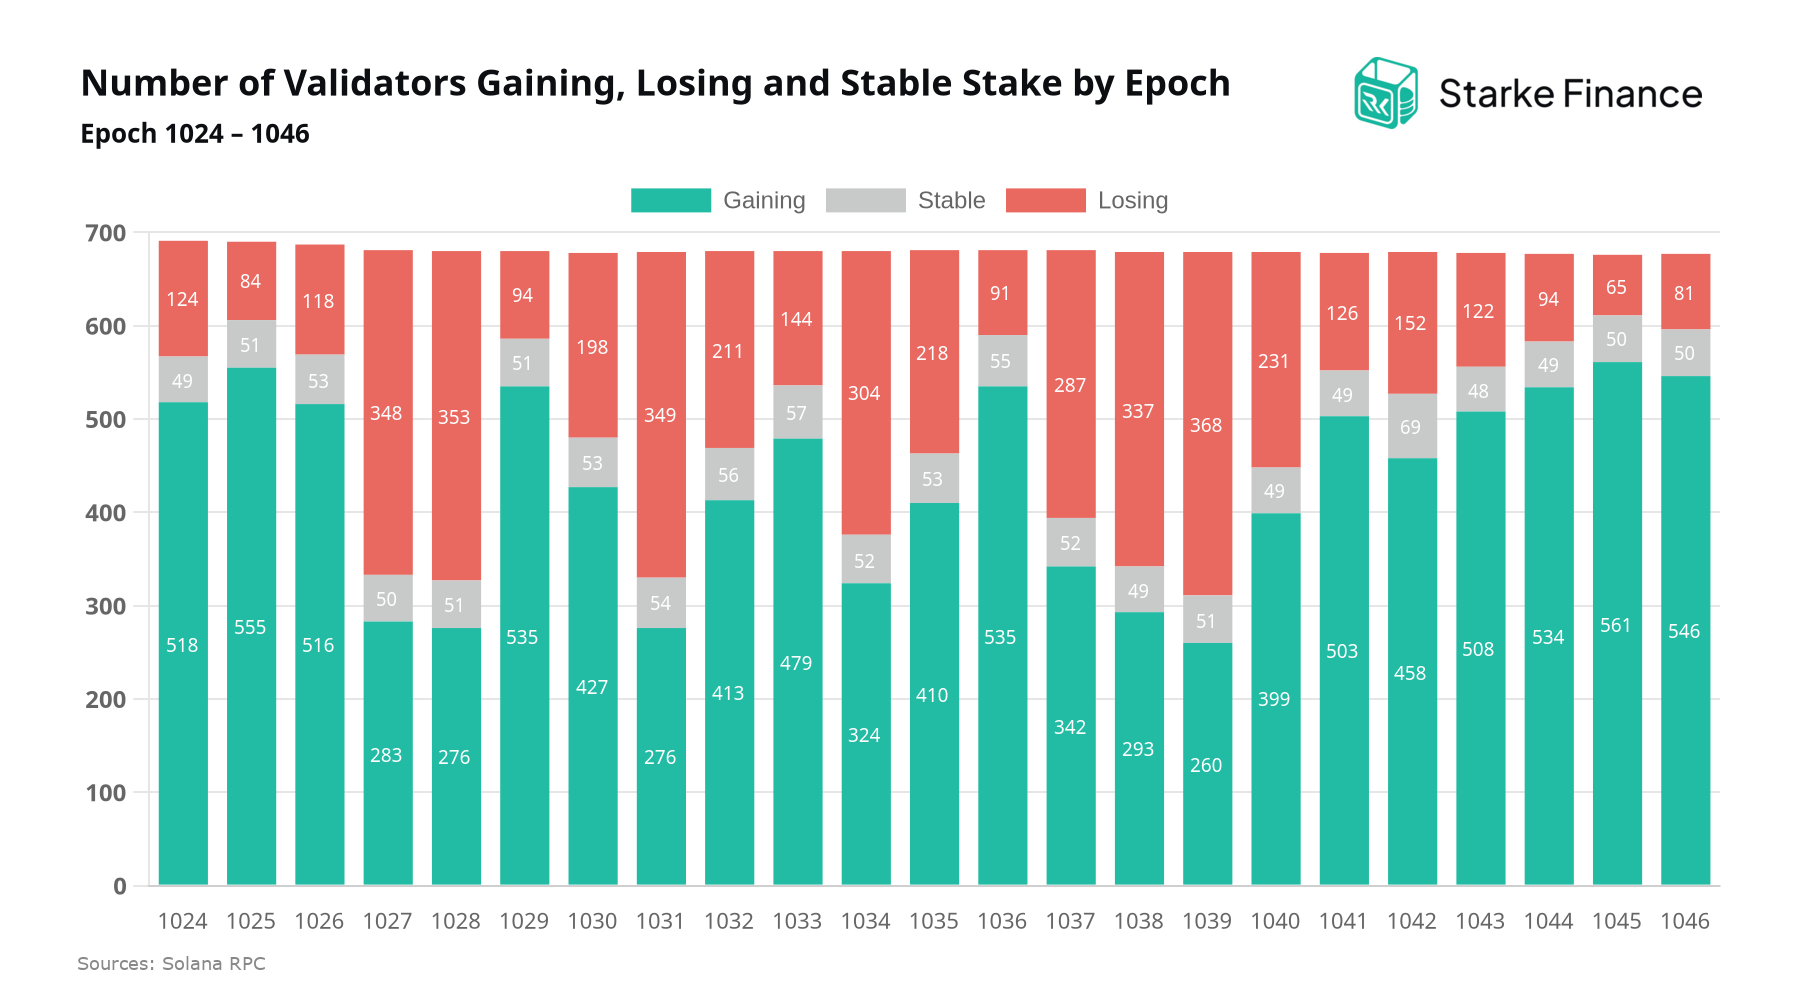
Across epochs 1024–1046, total active stake grew by 3,713,867 SOL, with an average of 63.58% of validators gaining stake, 28.75% seeing net outflows, and 7.67% holding steady each epoch. The breadth of participation on the gaining side is a constructive signal for decentralization: inflows are being distributed across a wide validator base rather than concentrating at the top, which is a relevant consideration for delegators weighing where additional stake is accruing on the network.
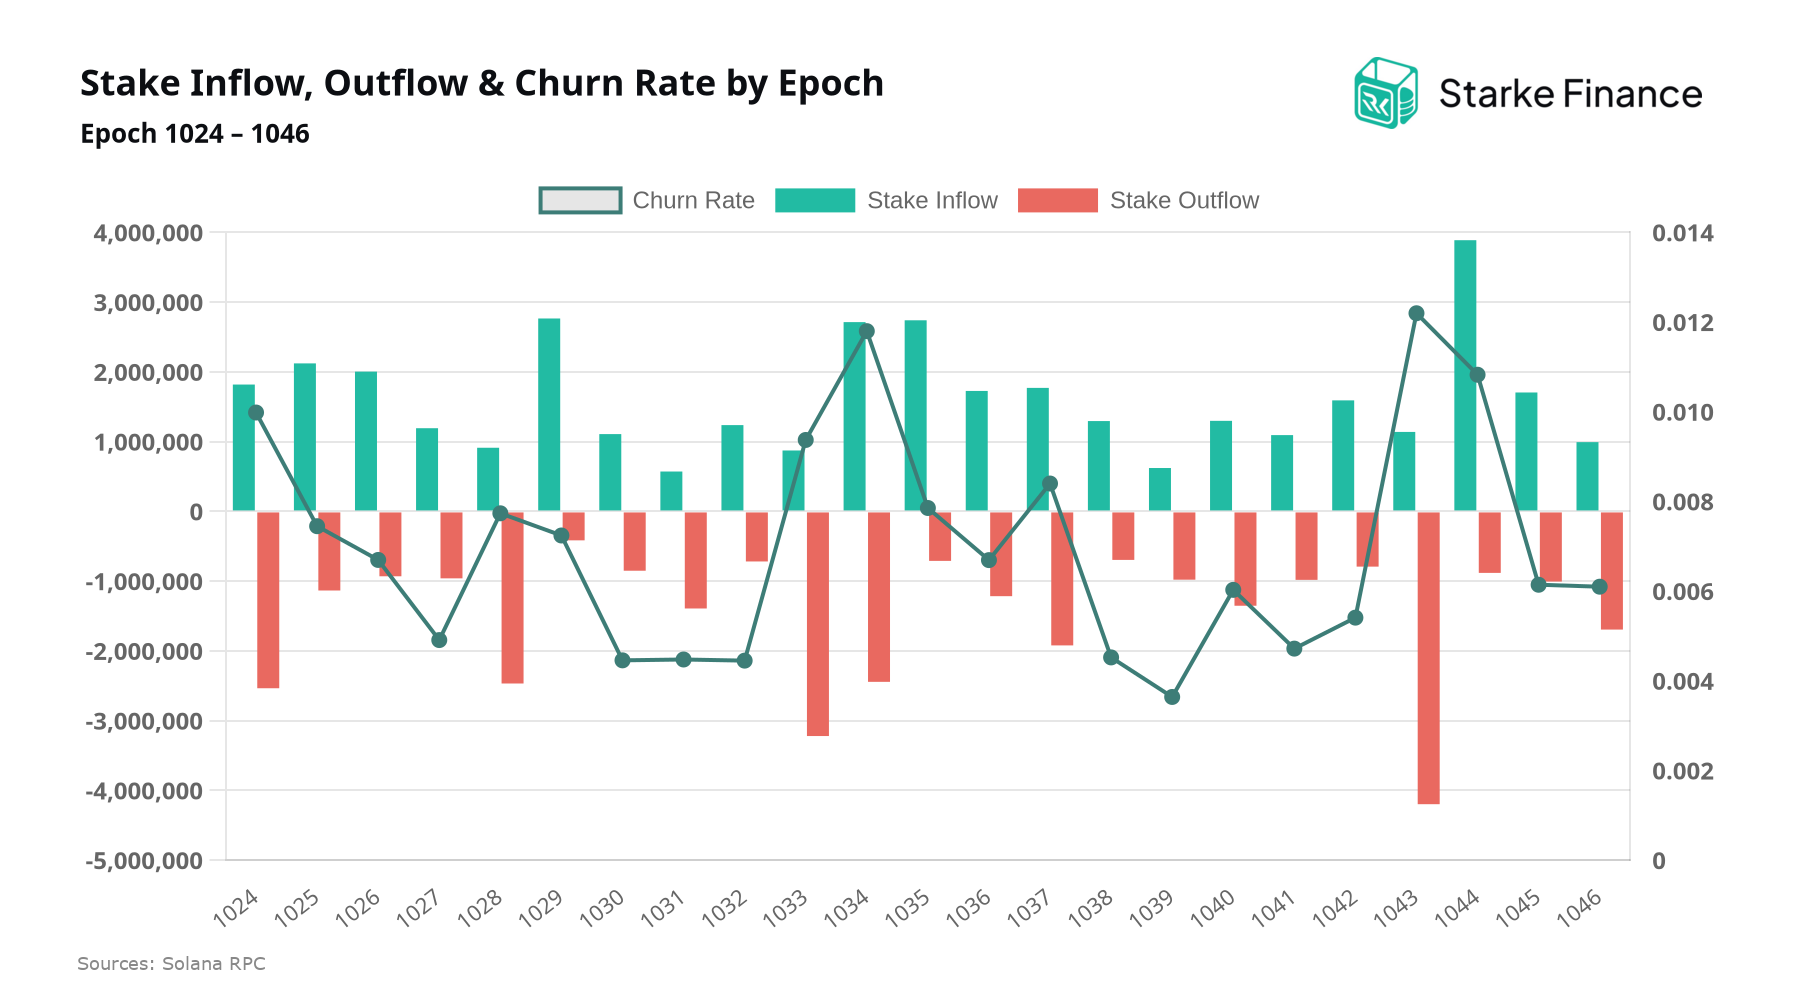
Stake Inflow, Outflow & Churn Rate by Epoch
Epoch-level stake flows provide a useful lens on delegator behavior and validator competition. Over the observed period, epoch 1044 recorded the strongest inflow at 3.9M SOL, while epoch 1043 saw the largest outflow at -4.2M SOL. Churn rate, measuring stake movement relative to total network stake, ranged from 0.36% to 1.22% and trended lower across the window, pointing to gradually reduced reallocation activity.
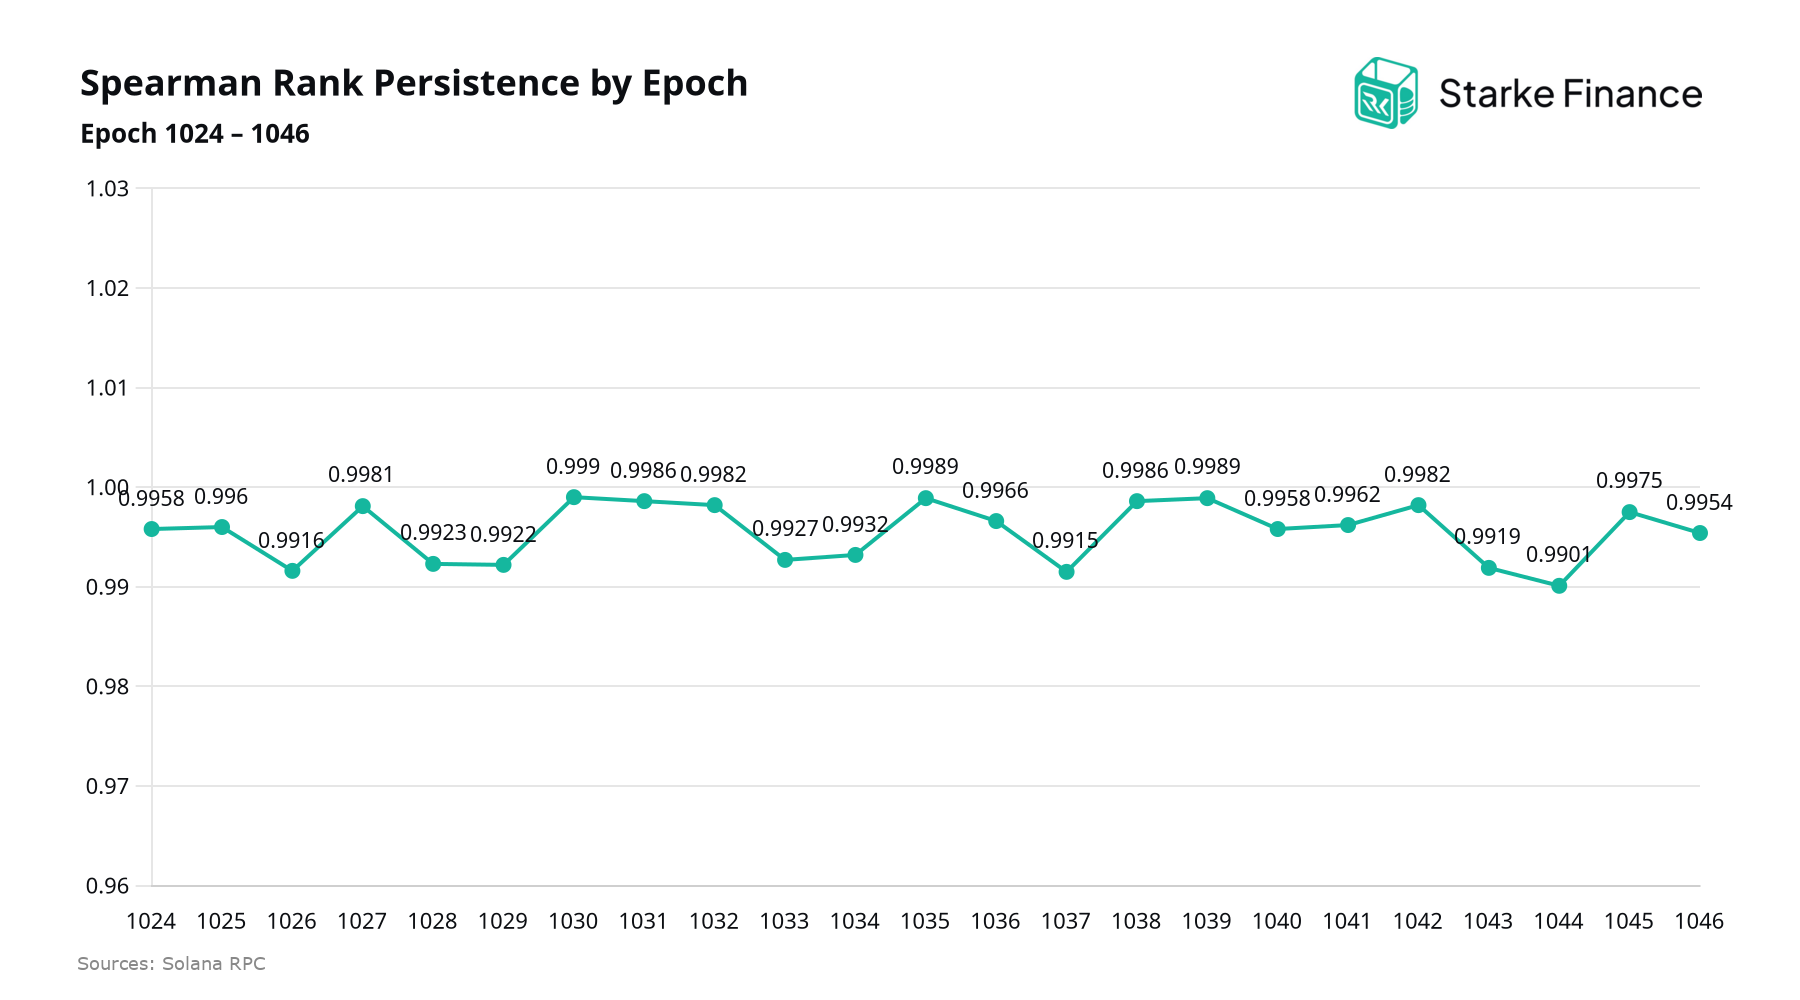
Spearman Rank Persistence by Epoch
Spearman Rank Persistence measures how stable the validator ranking by stake remains from one epoch to the next, with values closer to 1 indicating that validators broadly hold their relative positions. Across epochs 1024–1046, values ranged from 0.9901 to 0.9990, pointing to a high degree of stability in validator standings.
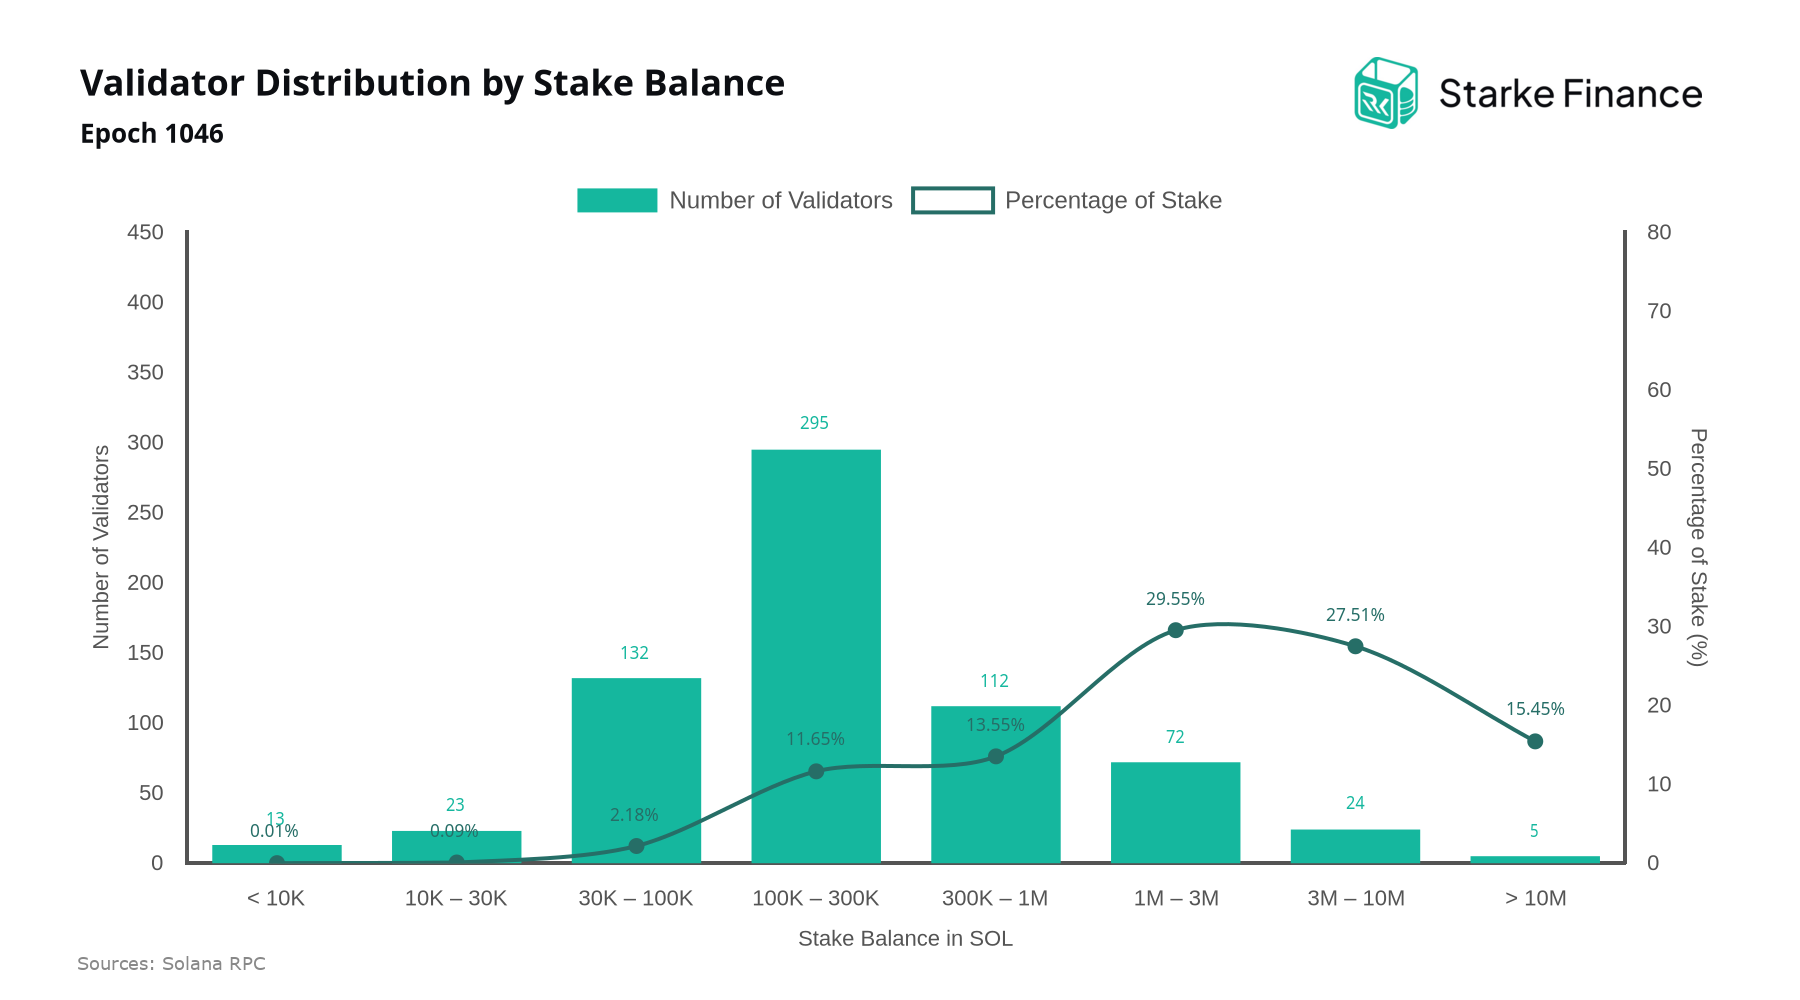
Validator Distribution by Stake Balance
As of epoch 1046, the 1M–3M SOL range leads stake concentration at 29.55%, held by 72 validators, followed by the 3M–10M SOL range at 27.51% across just 24 validators. This distribution highlights where effective voting power resides and is a key input for assessing censorship resistance and consensus resilience.
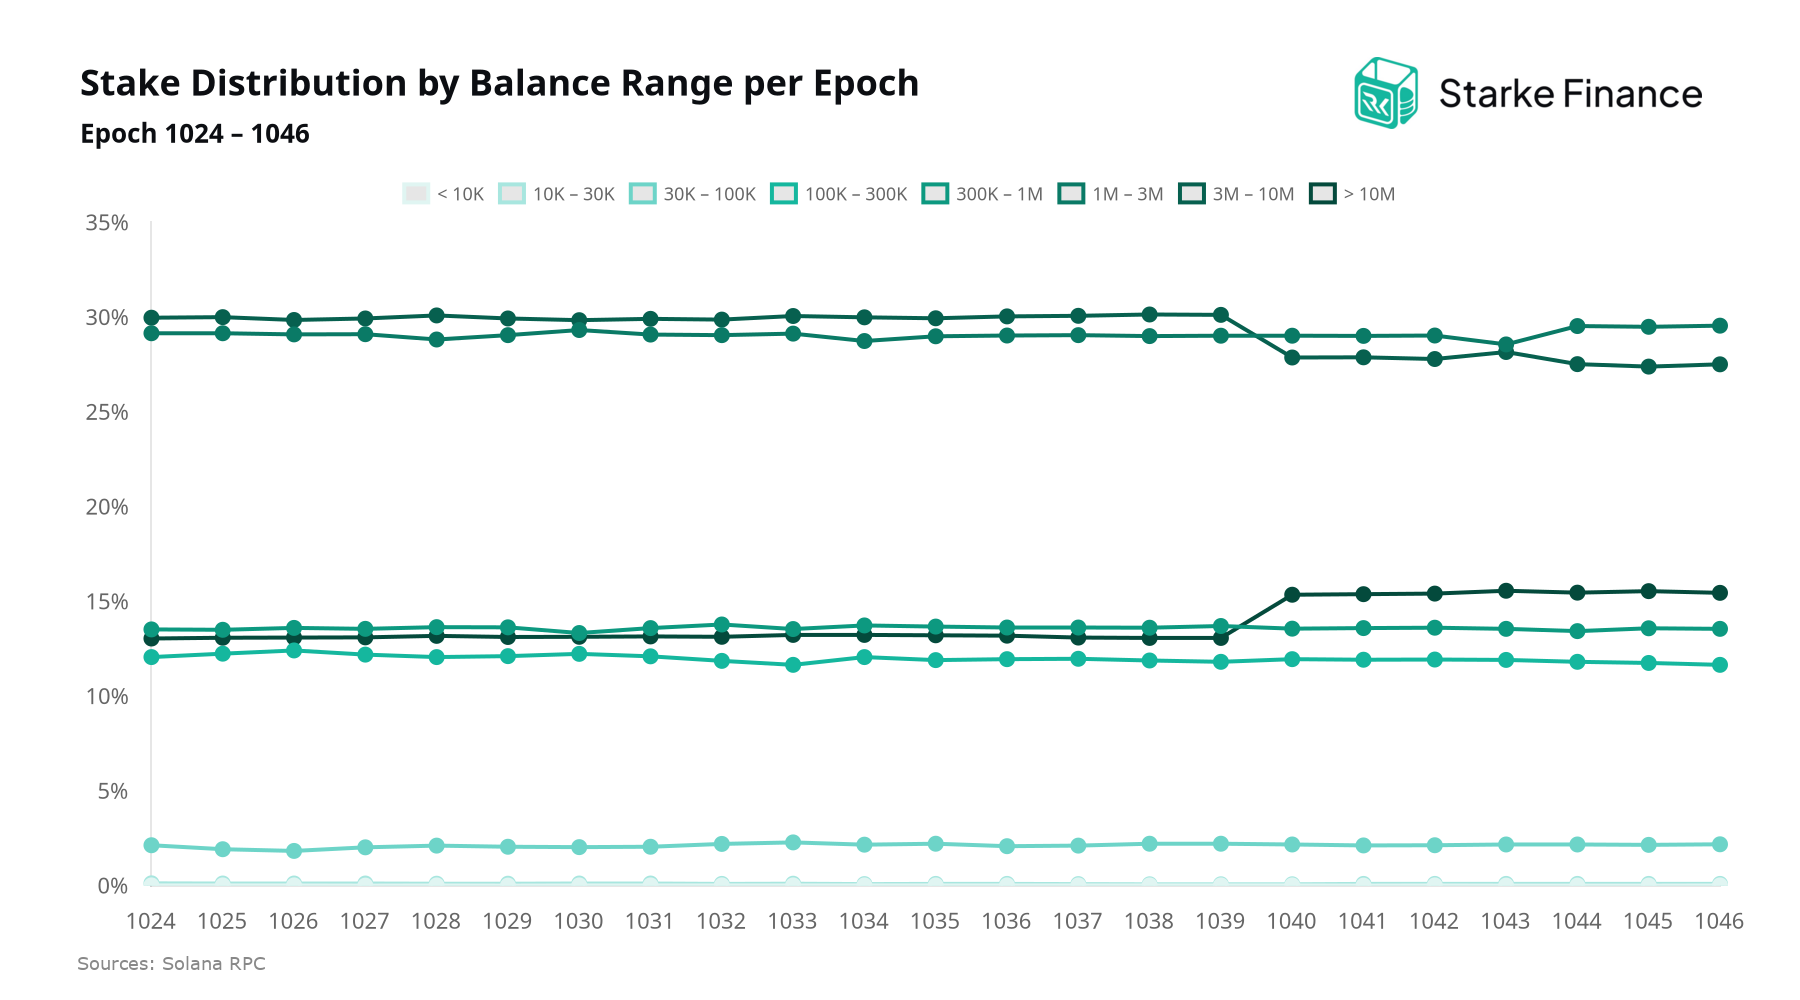
Validator Distribution by Stake Balance by Epoch
Between epochs 1024 and 1046, validators holding more than 10M SOL expanded their share of total stake from 13.04% to 15.45%, the largest gain across any cohort, while the 3M–10M SOL tier contracted from 29.97% to 27.51%, the steepest decline over the same window. The migration of stake toward the largest validators is a factor worth monitoring for delegators assessing concentration risk, as shifts at the top of the distribution directly influence the network's effective decentralization.
Solana Validator Client Distribution
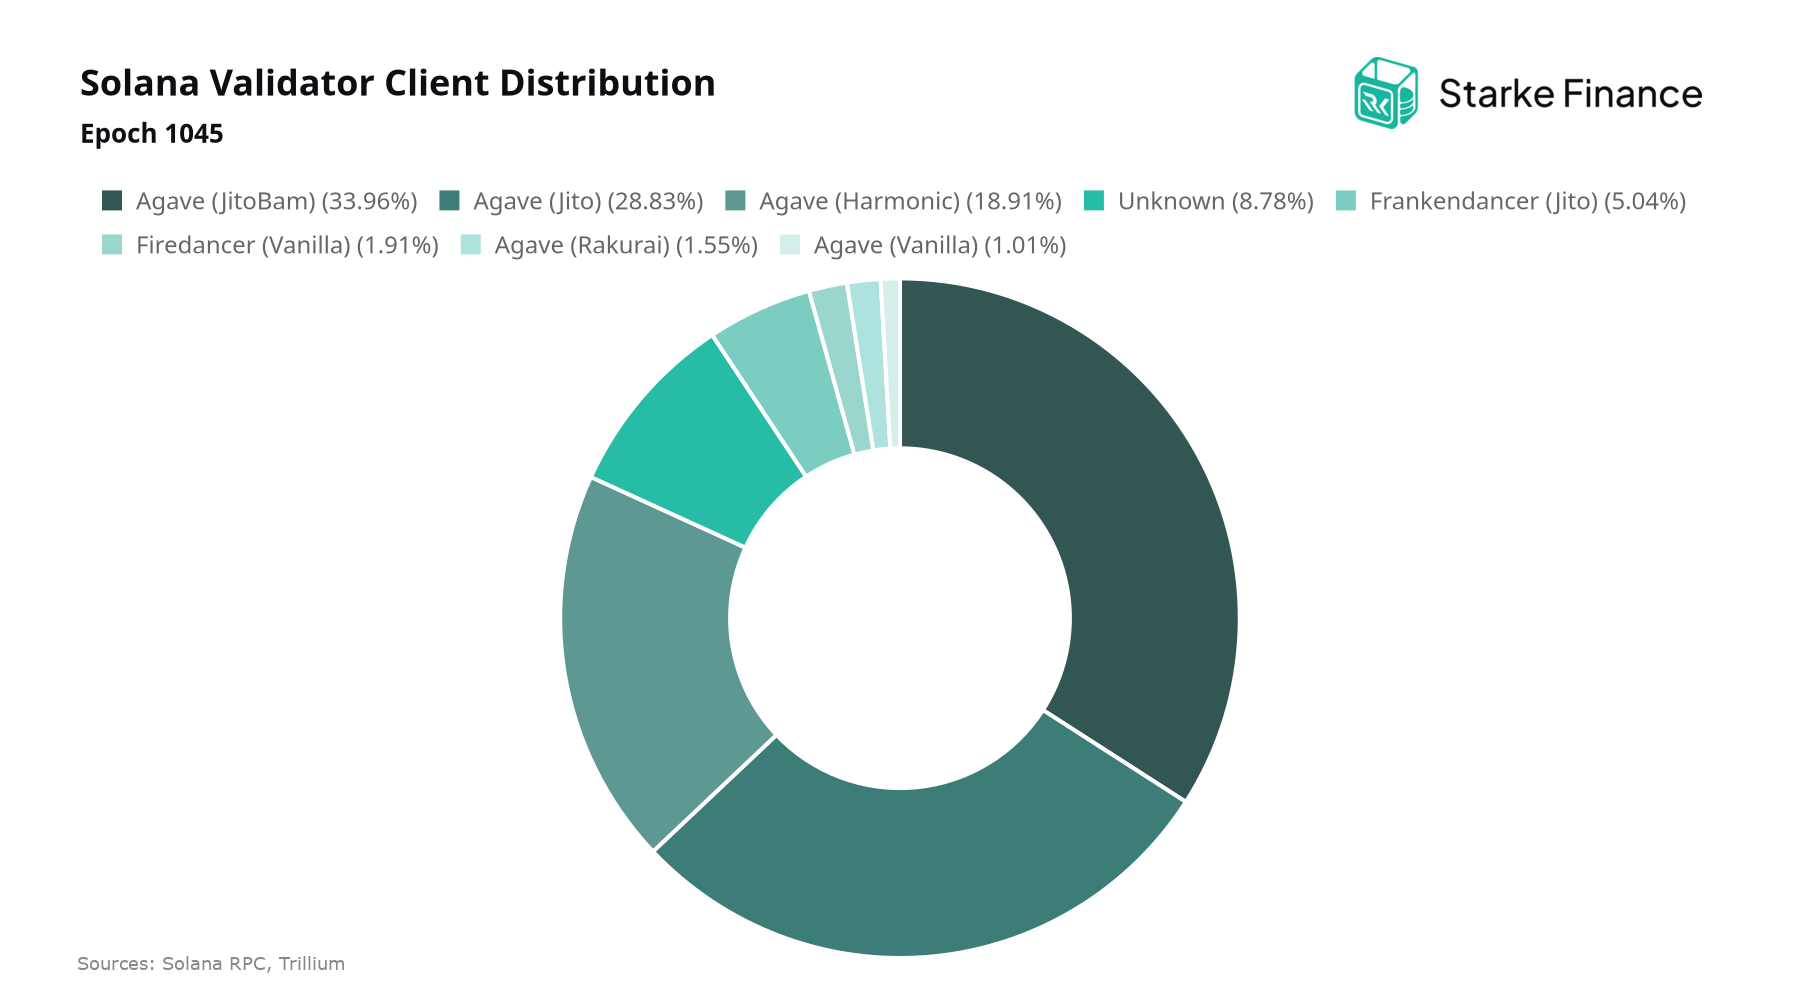
As of Epoch 1045, the Agave client dominates with 372M SOL (92.4%) across 611 validators, followed by Frankendancer at 22M SOL (5.5%) across 10 validators and Firedancer at 8M SOL (2.1%) across 14 validators. Breaking stake down by client-scheduler pairing, Agave (JitoBAM) accounts for 150M SOL (37%) across 370 validators, and Agave (Jito) for 127M SOL (32%) across 152 validators.
Solana Client Stake Distribution
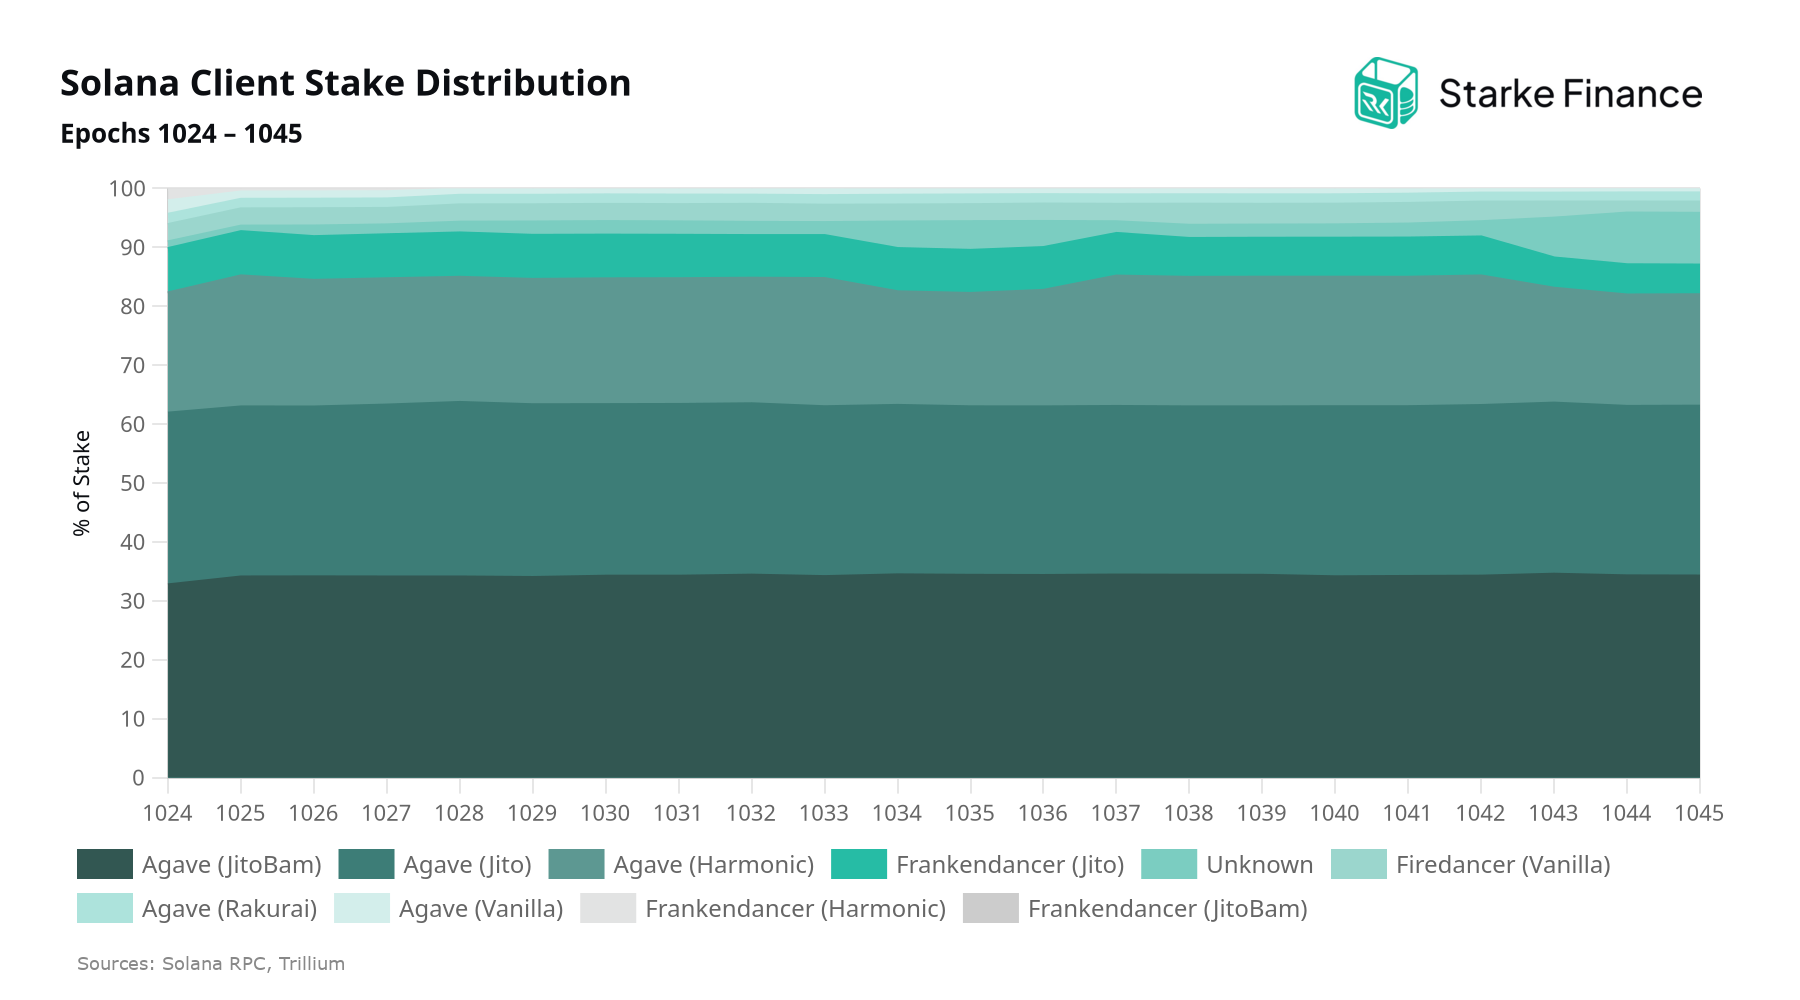
Client diversity remains a central input to Solana's resilience, and the latest epoch range shows the distribution moving in the wrong direction. Agave gained share, up from 87.0% at epoch 1024 to 92.4% at epoch 1045, while Frankendancer slipped from 10.0% to 5.5% and Firedancer eased from 3.0% to 2.1%. Validator counts tell a similar story: Agave down from 620 to 611, Frankendancer from 36 to 10, and Firedancer up from 10 to 14.
SOL Supply Distribution by Epoch
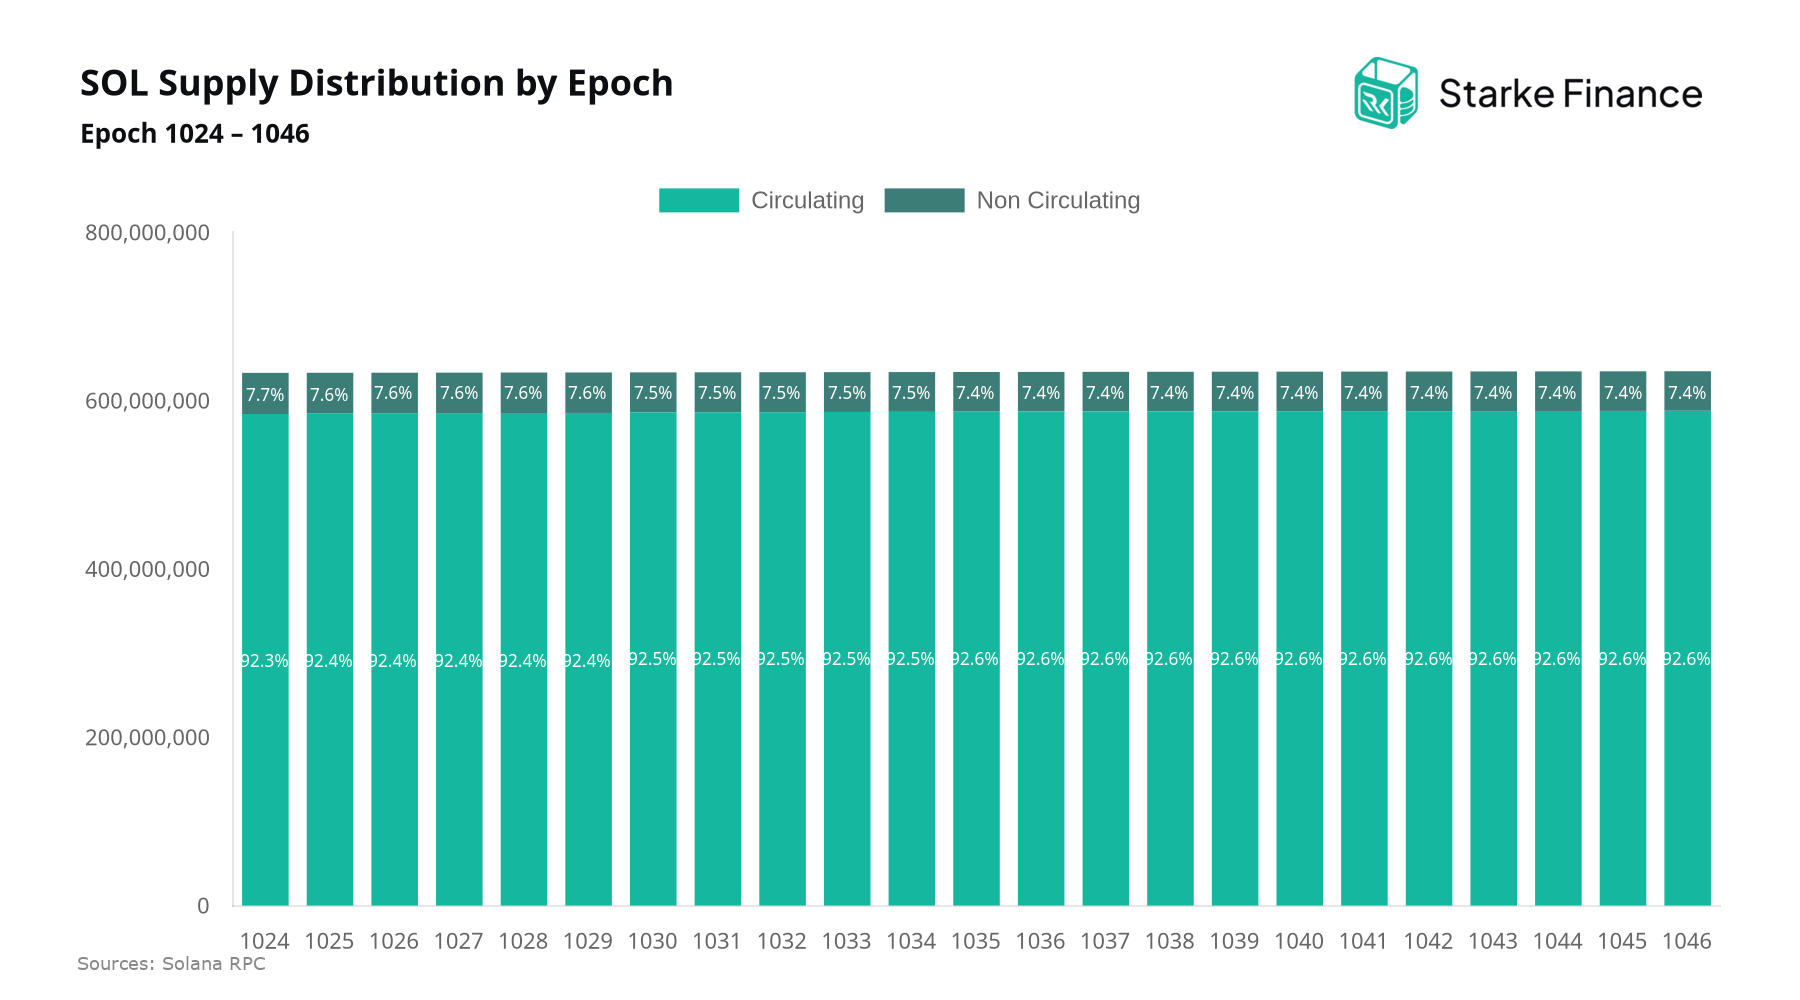
Across epochs 1024–1046, circulating supply expanded by 3,843,621 SOL while non-circulating supply contracted by 1,927,032 SOL, producing a net increase of 1,916,589 SOL in total supply. As of epoch 1046, total supply stands at 634,996,500 SOL, with circulating holdings representing 92.6% (588,006,342 SOL) and non-circulating 7.4% (46,990,157 SOL).
SOL Staking Ratio
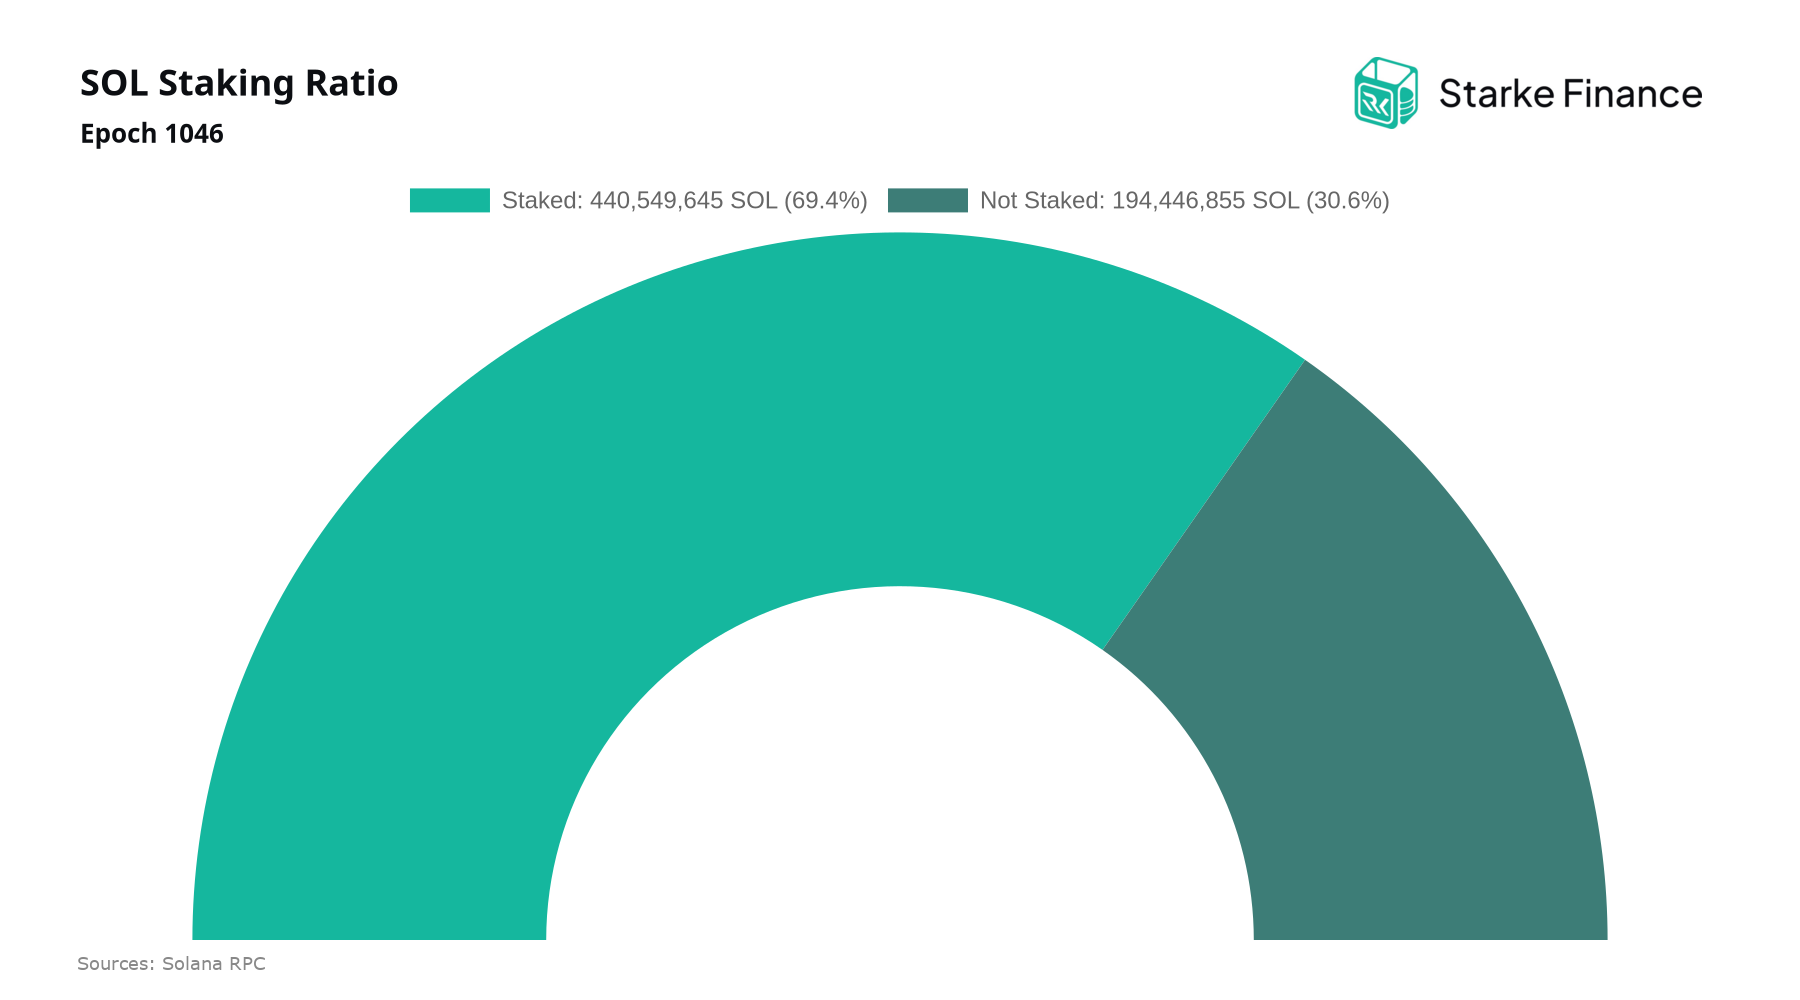
As of epoch 1046, 440,549,645 SOL is actively staked, representing 69.4% of total supply. This is among the highest staking ratios of any major proof-of-stake network and reflects a deep base of economic security underpinning Solana. For allocators, a sustained ratio at these levels indicates that validators are well-capitalized and that the opportunity cost of not staking remains material, both relevant inputs when assessing network resilience and expected real yield.
Total Active Stake & Staking Ratio by Epoch
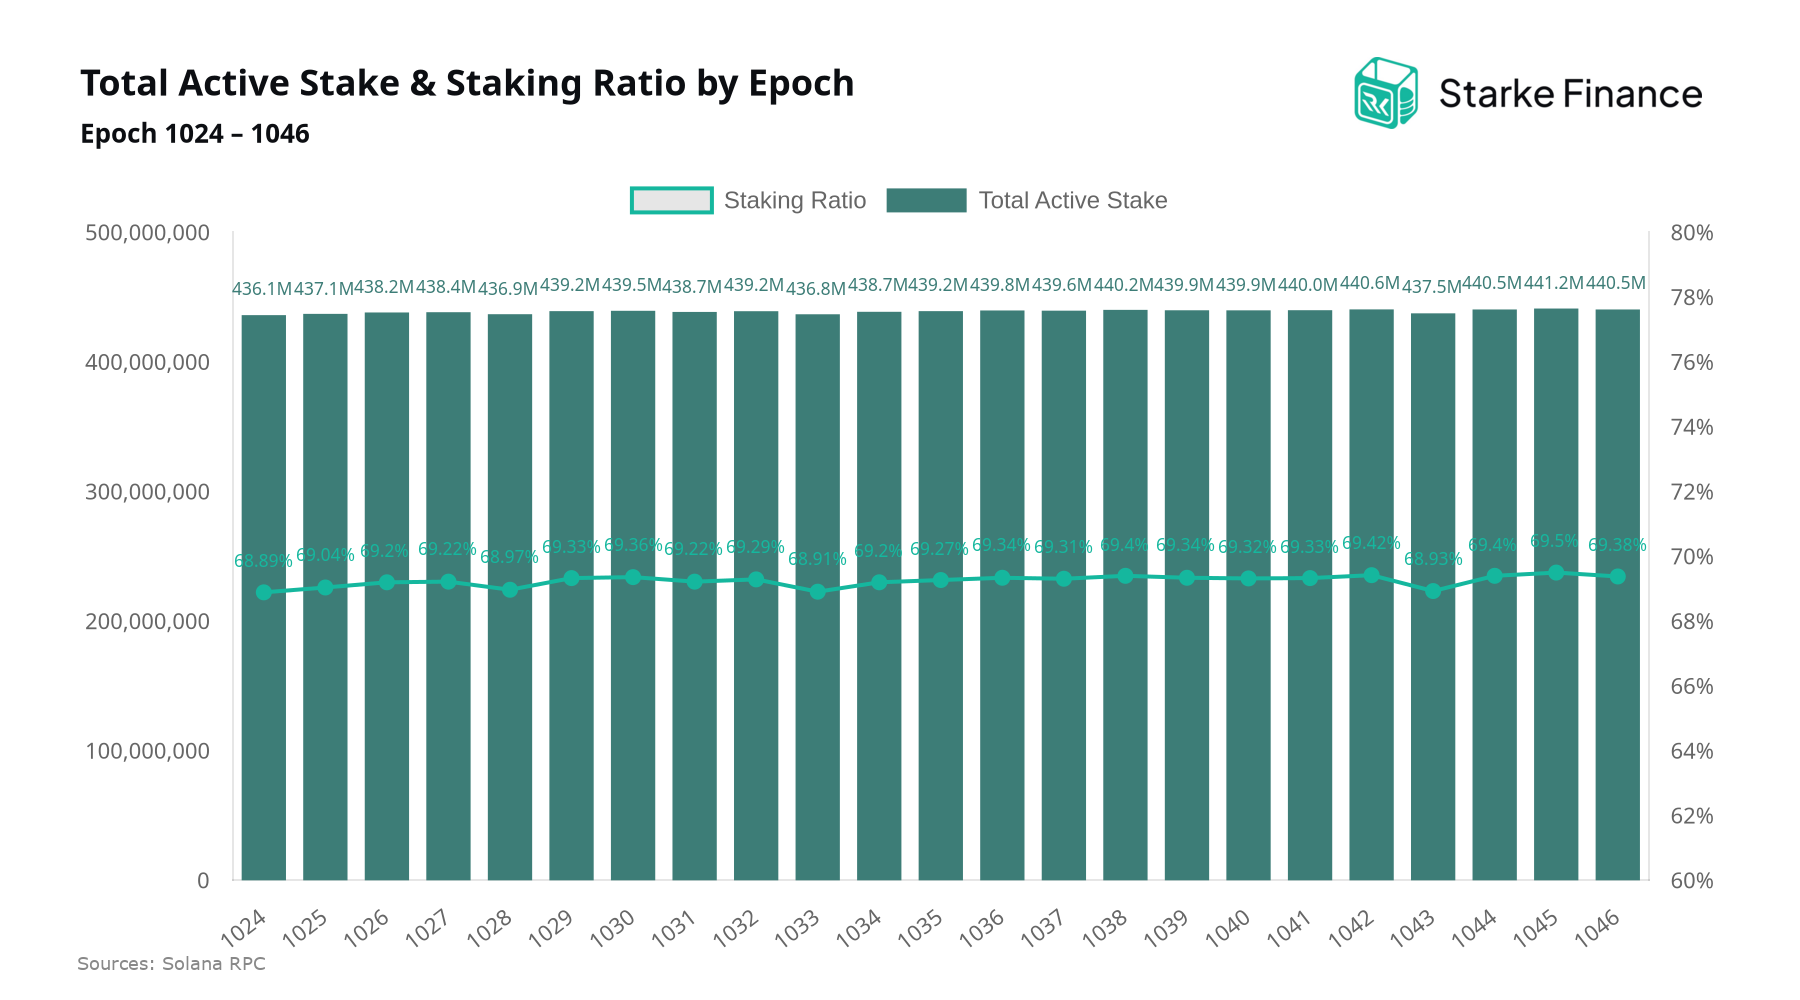
Total active stake increased from 436,134,289 to 440,549,645 SOL between epochs 1024 and 1046, a net addition of 4,415,356 SOL. Over the same window, the staking ratio moved from 68.9% to 69.4% of circulating supply. Both measures point to a gradual deepening of economic security on the network, a relevant signal for allocators assessing Solana's validator base and for stakers evaluating the stability of the underlying consensus set.
Top 10 Stake Movements Between Cities
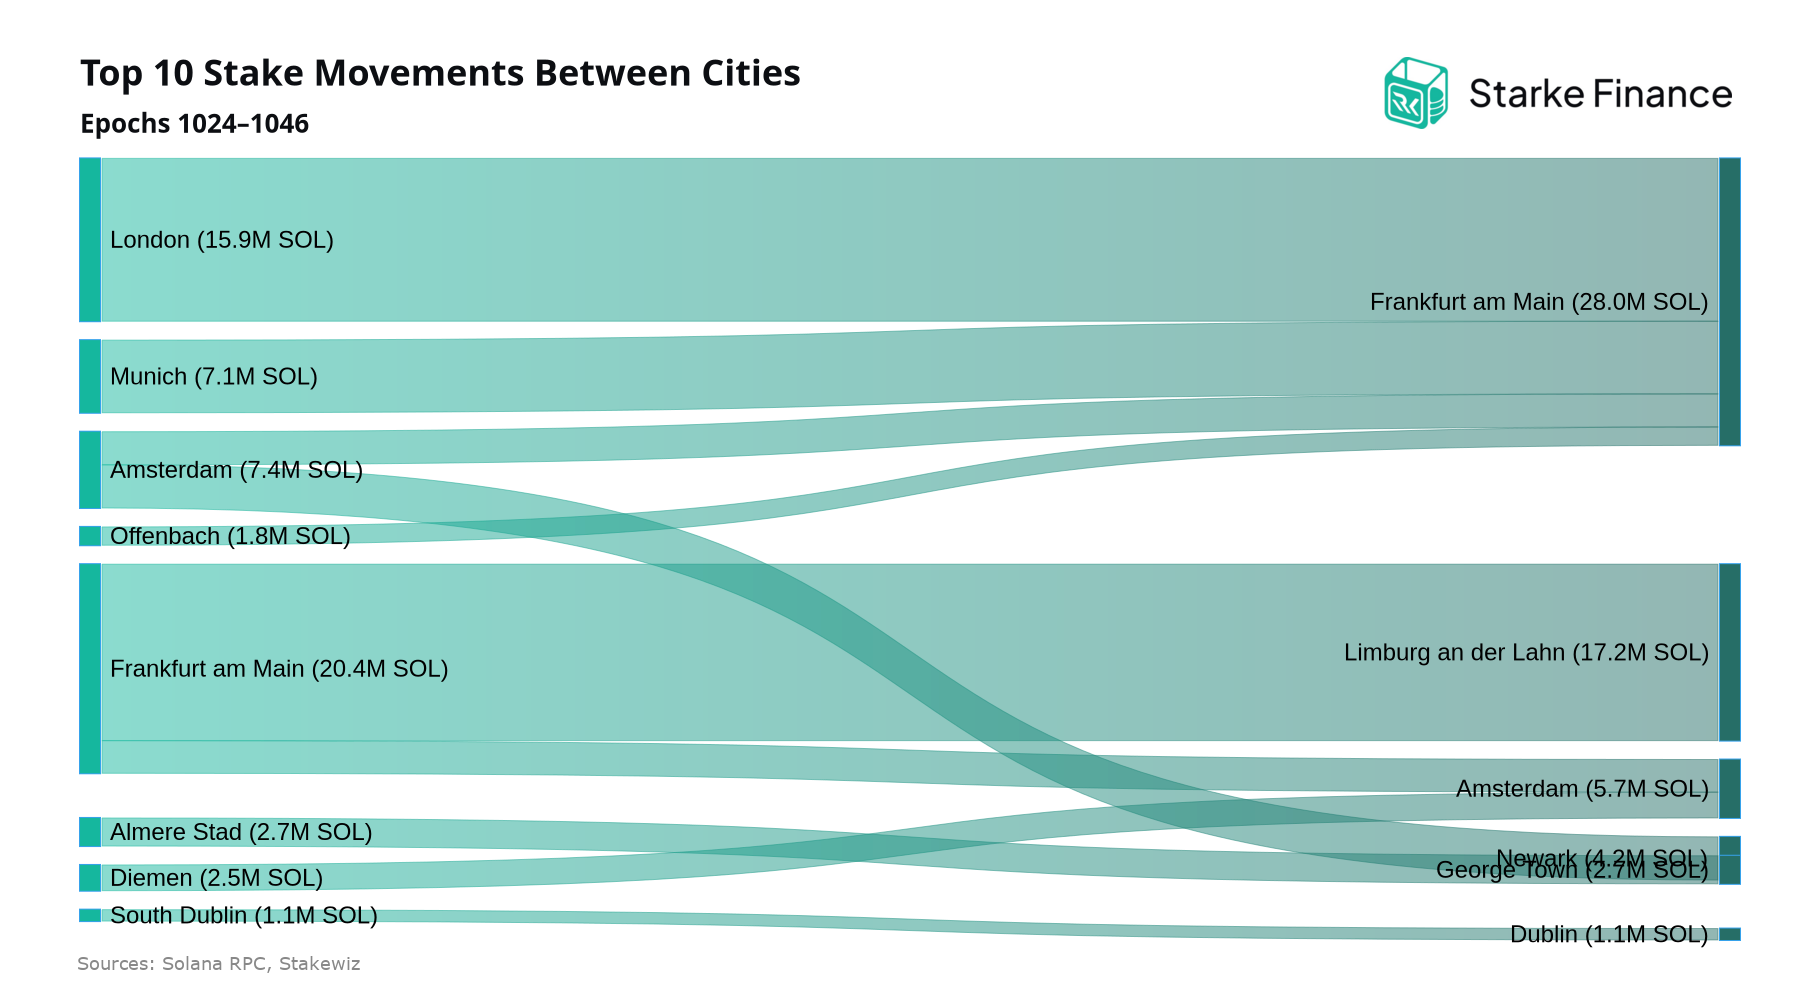
Over the last 23 epochs, the largest stake movement between cities was 17.2M SOL from Frankfurt am Main to Limburg an der Lahn across 1 validator, followed by 15.9M SOL from London to Frankfurt am Main across 1 validator. Both flows reflect single-validator relocations rather than broad delegator rebalancing, a reminder that individual operator decisions on data center or jurisdiction can meaningfully reshape Solana's geographic stake distribution and warrant close monitoring from a decentraliza
Top 10 Cities by Stake
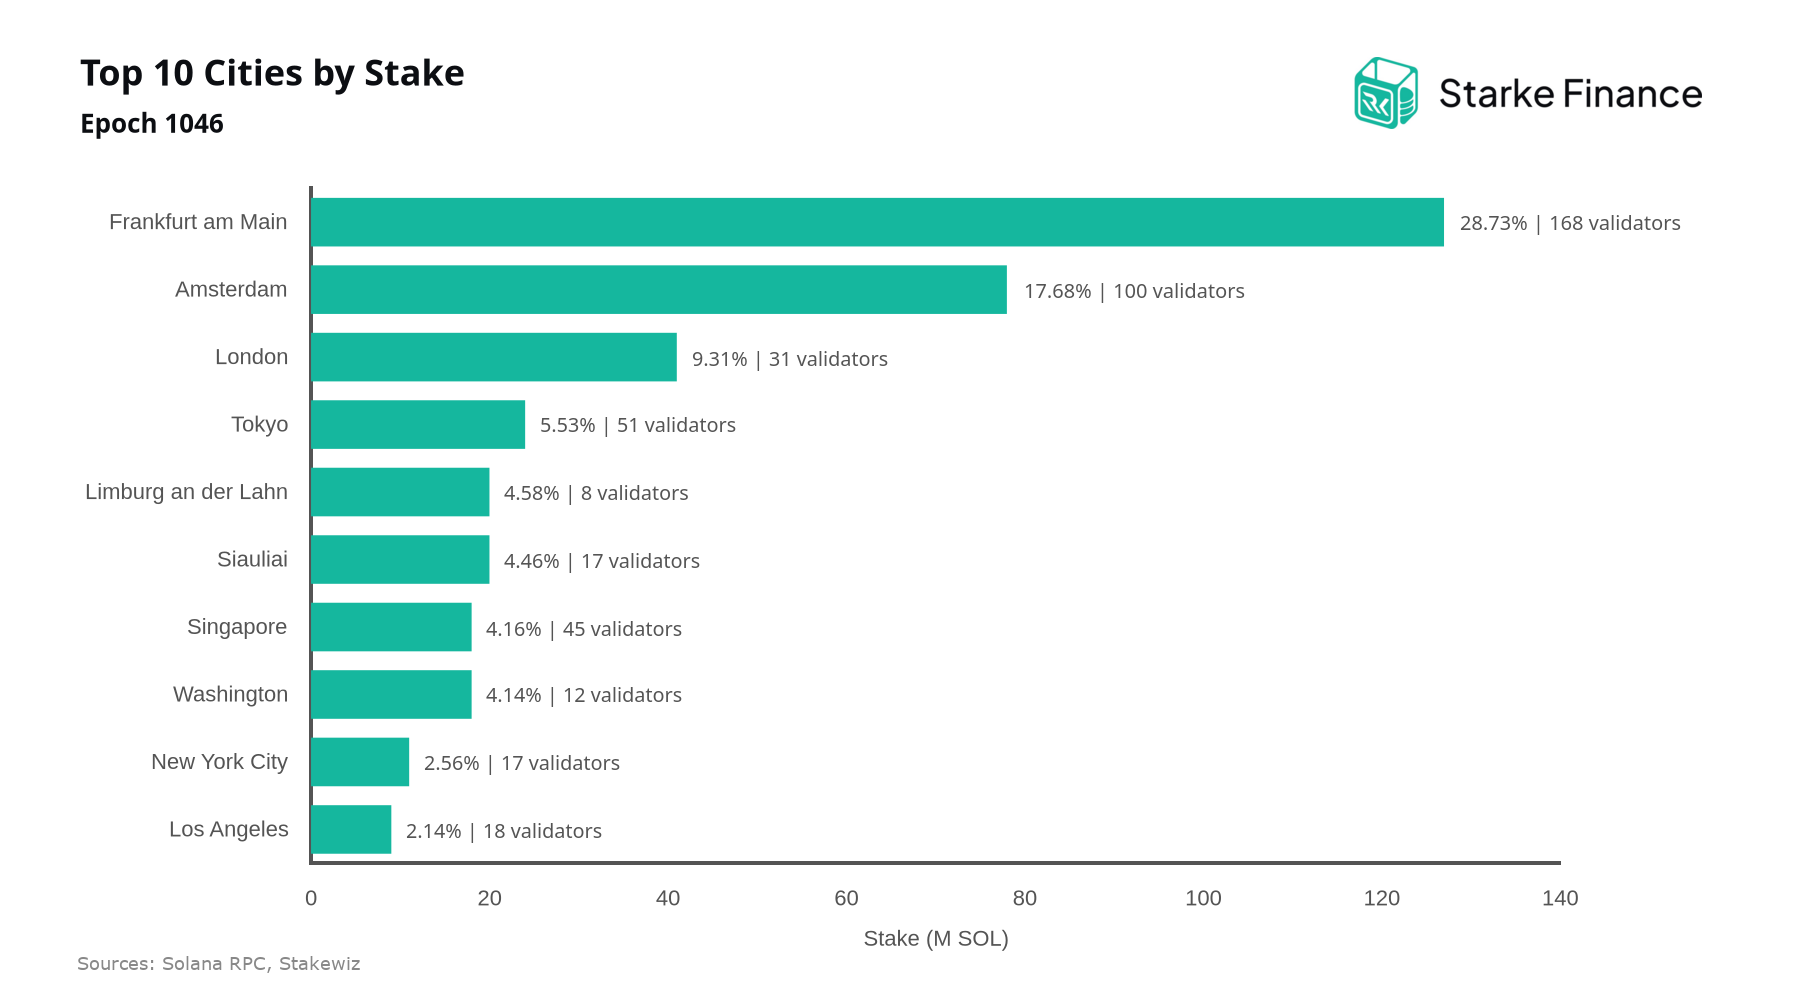
Geographic distribution of stake across the top cities remains relatively dispersed, though concentration edged higher over the last 23 epochs, with the HHI rising from 1296 to 1357. Movement at the city level was pronounced: Limburg an der Lahn posted the largest increase at +695.1%, while Munich recorded the steepest decline at -97.3%.
Top 10 Stake Movements Between Countries
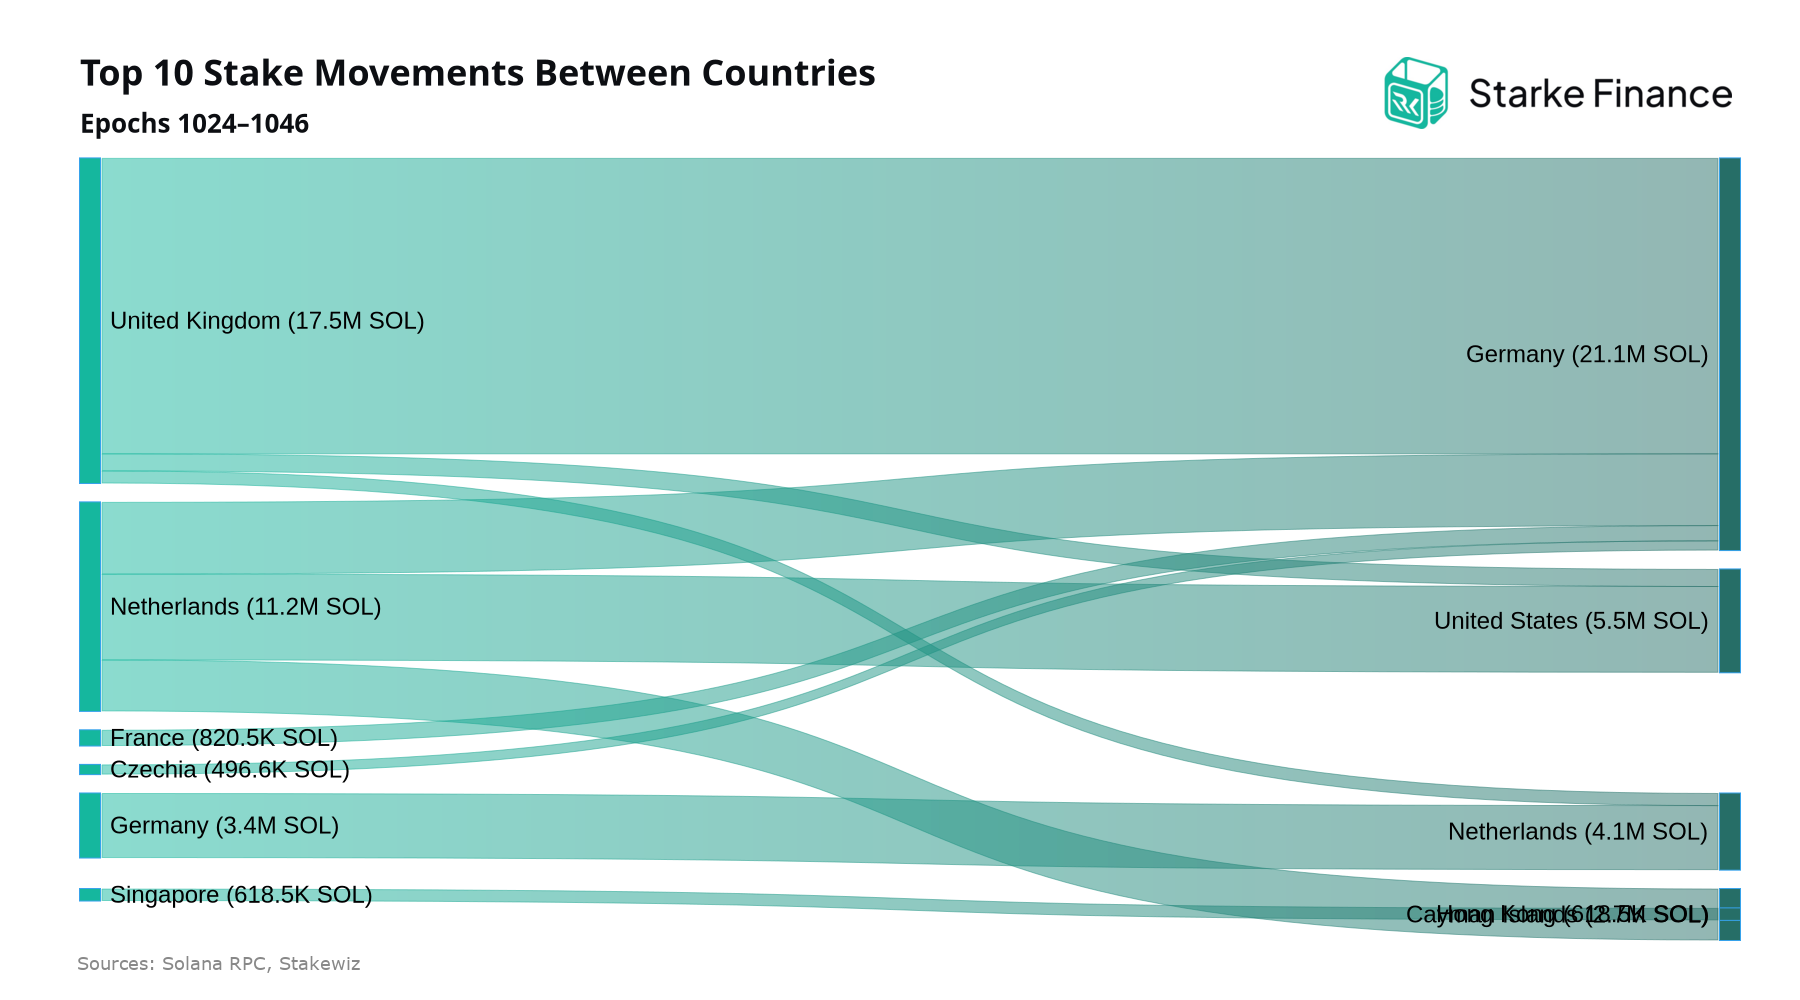
Cross-border stake migration offers a useful lens on validator-level geographic concentration. Over the last 23 epochs, the largest movement between countries was 15.9M SOL from the United Kingdom to Germany across a single validator, followed by 4.6M SOL from the Netherlands to the United States across 3 validators. The dominance of a single-validator relocation underscores how operator-level decisions can meaningfully reshape the network's jurisdictional footprint from epoch to epoch.
Top 10 Countries by Stake
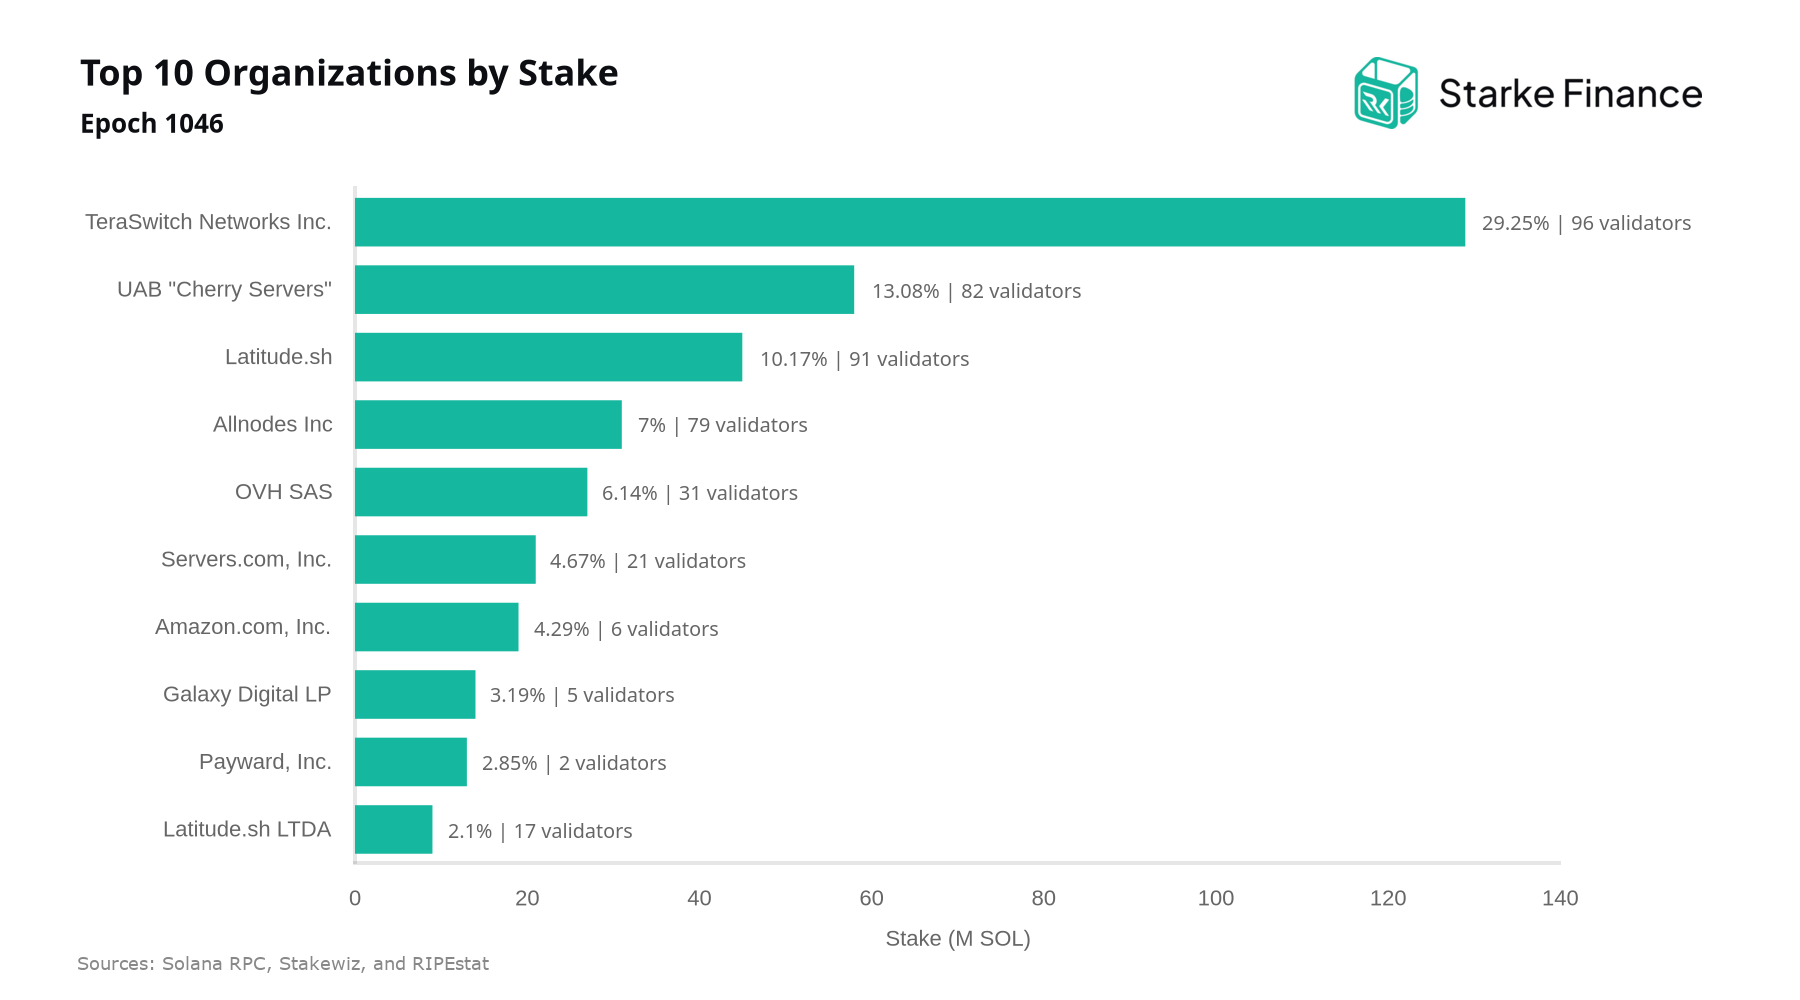
Geographic distribution of stake remains a key dimension of Solana's resilience, as concentration in any single jurisdiction exposes the network to localized regulatory or infrastructure risk. Over the last 23 epochs, country-level concentration stayed moderate but drifted higher, with the HHI rising from 1,772 to 1,952. Poland saw the largest increase at +49.2%, while Czechia recorded the steepest decline at -83.2%.
Top 10 Stake Movements Between Organizations
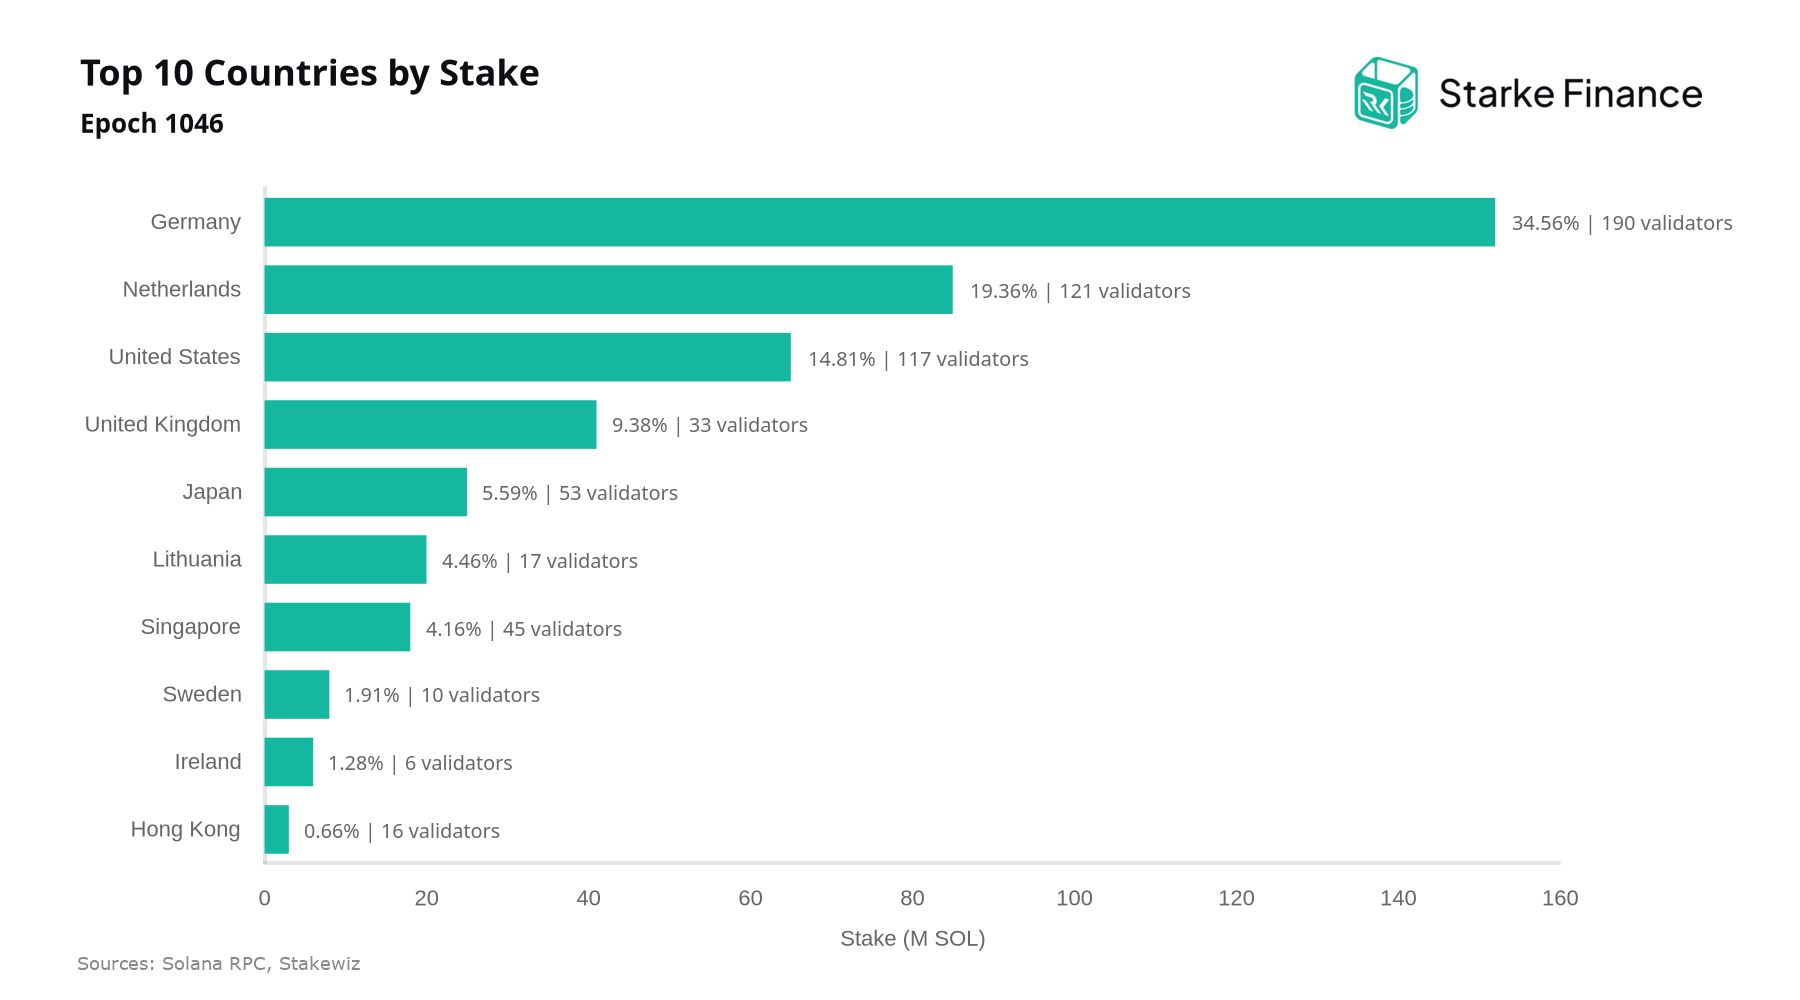
Over the last 23 epochs, the largest stake movement between organizations was 17.2M SOL from Latitude.sh to OVH SAS across 1 validator, followed by 16.7M SOL from Helius to TeraSwitch Networks Inc. across 2 validators. These shifts highlight how concentrated reallocations at the hosting-provider level can meaningfully reshape the infrastructure footprint of the network, a dynamic worth monitoring for stakers assessing operator diversity and resilience against correlated outages.
Top 10 Organizations by Stake
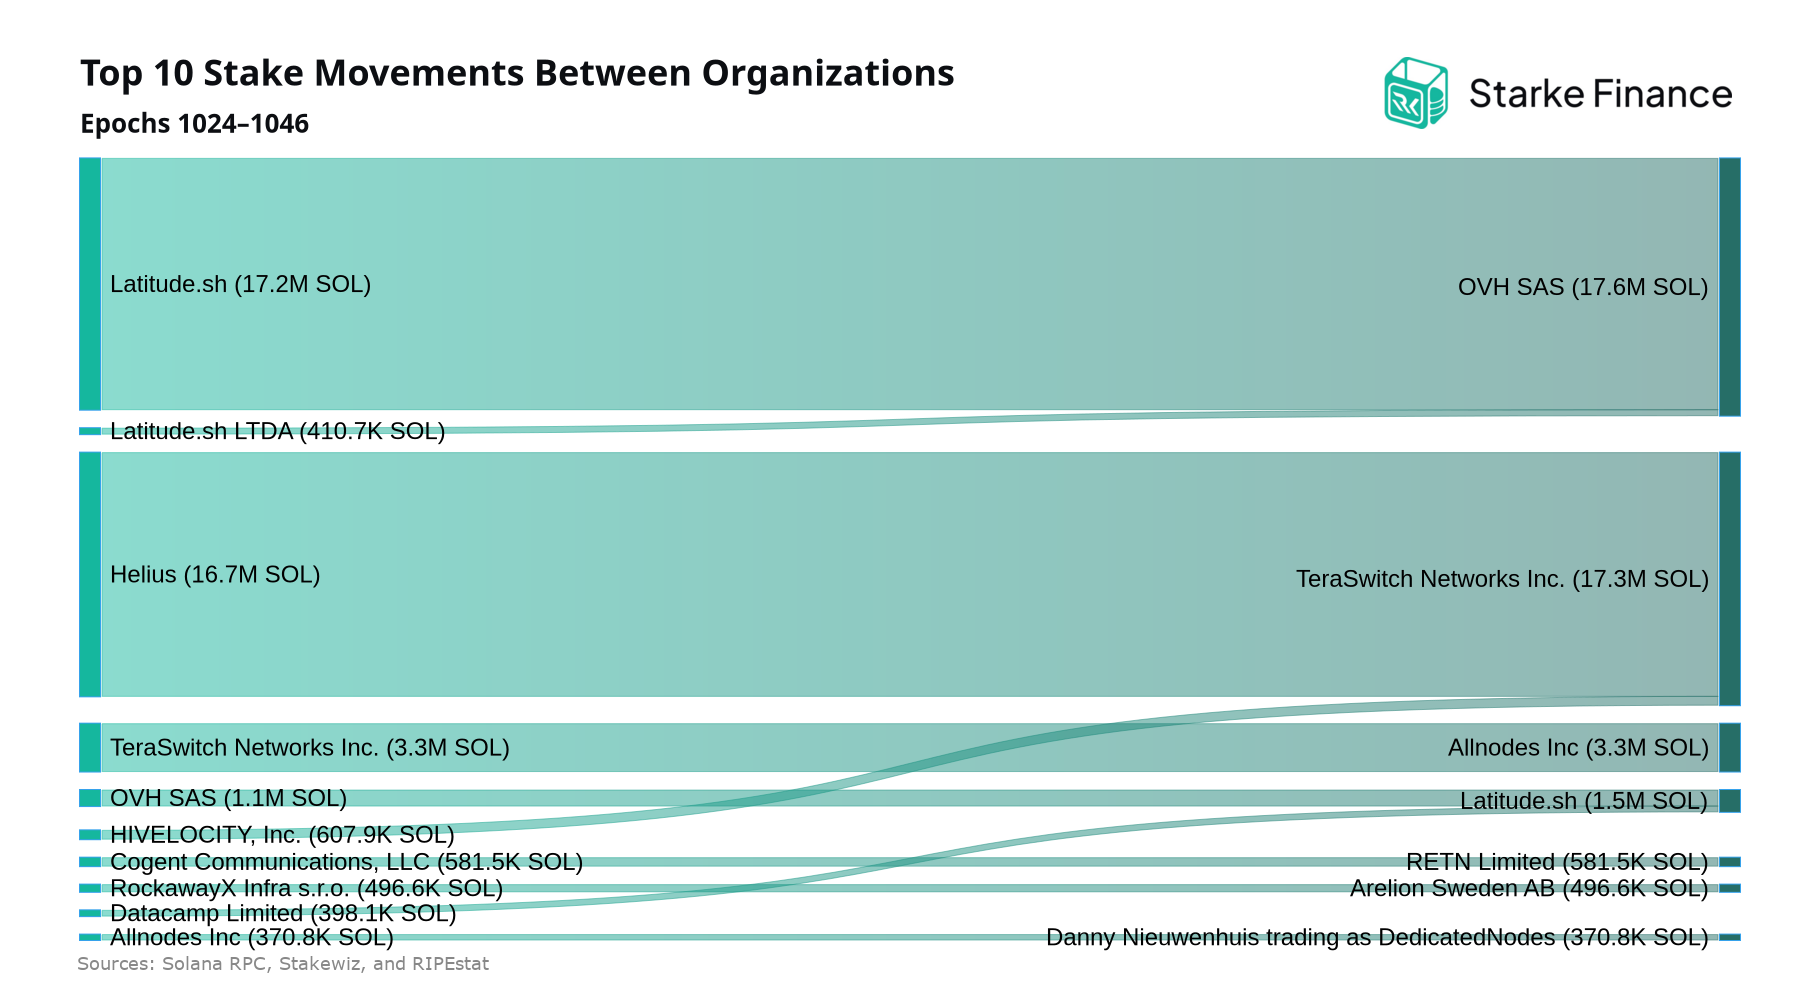
Over the last 23 epochs, stake concentration by organization remained low but drifted higher, with the HHI rising from 1,168 to 1,297 — still well within competitive territory, but a trend worth monitoring for stakers assessing infrastructure diversity. OVH SAS saw the largest increase at +176.4%, while RockawayX Infra s.r.o. recorded the sharpest decline at -82.3%. TeraSwitch Networks Inc.
Maximize your Solana rewards with Starke Finance
- Higher yield potential: optimized validator selection built to capture more of Solana's staking rewards.
- Zero fees: we don't take a cut of your staking rewards.
- Transparency & control: track your stake and rewards in real time.
- Reliable infrastructure: institutional-grade validator operations built for uptime.
Disclaimer
This report is provided for informational purposes only and does not constitute investment, legal, or tax advice. Staking involves risk, including the risk of loss and slashing. Past performance is not indicative of future results. Please do your own research and consult a professional advisor before making financial decisions.
Contributors

Oscar GarciaFounder & CEO